David Gruen and Amanda Sayegh
Treasury Working Paper
2005 — 04
November 2005
This paper was prepared for a special issue of the Oxford Review of Economic Policy on Reinventing Fiscal Policy as a Tool of Macroeconomic Management. We are grateful to Graeme Davis, Guy Debelle, Phil Gallagher, Nicholas Gruen, Steven Kennedy, David Martine, Jason McDonald, Adam McKissack, PaulO’Mara, Martin Parkinson, David Vines and two anonymous referees for helpful comments on an earlier draft. The views expressed are those of the authors, and not necessarily those of the Australian Treasury.
Abstract
This paper examines the evolution of Australian fiscal policy and the fiscal policy framework over the past quarter-century. Following the early 1980s recession, a sustained fiscal consolidation saw the general government budget balance (for all levels of government) move from a deficit of 3 per cent of GDP in 1983-84 to a surplus of 1per cent five years later in 1988-89. A severe recession in the early 1990s interrupted this process, and the budget returned to sizeable deficits which peaked at 4 per cent of GDP in 1992-93. The second half of the 1990s saw a repeat of the experience a decade earlier, with the budget returning to surplus in 1997-98. In contrast to the 1980s experience, however, the general government sector (for all levels of government) has recorded surpluses for the subsequent eight years to the present.
The paper outlines Australia’s macroeconomic experience over this time and argues that there have been two significant medium-term factors motivating the extended periods of fiscal consolidation. The first factor, relevant since the mid1980s, has been the large Australian current account deficits since that time, and the associated build-up of net foreign liabilities. The second factor, which entered the public debate more recently, is a desire to provide fiscal policy flexibility to respond to the ageing of the population and the projected rising public cost of health services — both influences that are likely to be of increasing importance over the next generation or so.
The paper discusses the introduction and evolution of Australia’s medium-term fiscal framework which has been put in place to respond to these challenges.
JEL Classification Numbers: E62, F32, H60
Keywords: fiscal policy framework, current account, fiscal effects of ageing
Contents
2. A quarter-century of the Australian macroeconomy
3. The evolution of fiscal policy
4. The development of a medium-term framework for fiscal policy
Appendix — The arithmetic of accumulating liabilities
The evolution of fiscal policy in Australia
David Gruen and Amanda Sayegh
1. Introduction
This paper describes the evolution of Australian fiscal policy and the fiscal policy framework over the past quarter-century. The focus is primarily on the medium-term influences on fiscal policy, rather than its counter-cyclical role. The paper explains how the fiscal policy framework has evolved and examines the economic developments that have had the most significant influence on this evolution.
The most important of these developments has been the large current account deficits (CADs) run by the Australian economy over the past two decades, and the paper documents their influence on fiscal policy over this time. Given Australia’s unusual experience in this regard, both the political-economic interaction between large CADs and the fiscal policy response to them, and the debate about the relevance of large CADs for public policy, may be of particular interest to an international audience.
The other important medium-term influences on which the paper focuses are the fiscal implications of the ageing of the population and the projected rising public cost of health services. These issues have risen to public prominence more recently than the CAD, but their influence on fiscal policy has been growing, and is likely to continue to grow over the next generation or so.
The paper begins, in section 2, with a thumbnail sketch of the Australian macroeconomy over the past quarter-century. In common with most industrial countries, Australia experienced serious recessions in the early 1980s and early 1990s. Since the early 1990s, however, the Australian economy has performed impressively, despite the significant external shocks of the Asian crisis in 1997-98 and the worldwide economic downturn of 2001, as well as a severe extended drought beginning in 2002-03.
Section 3 of the paper describes fiscal policy outcomes over the past quarter-century, before turning to the main medium-term influences on fiscal policy. The large current account deficits run by the Australian economy for the past two decades are discussed, with a particular focus on the continuing debate over the extent to which these deficits should be of public-policy concern. The section then turns to a discussion of the projected fiscal implications of the ageing of the population and rising public health costs.
The final substantive section of the paper, Section 4, discusses the development of a medium-term fiscal framework in Australia. Elements of a medium-term framework first began to emerge in the mid 1980s with a set of medium-term fiscal rules. It was not until the second half of the 1990s, however, that a fully articulated medium-term fiscal framework was introduced, with the development of the Charter of Budget Honesty. The paper explains the development of the framework, and discusses its gradual evolution as it has matured. The paper ends with a brief conclusion.
2. A quarter-century of the Australian macroeconomy
The Australian macroeconomy entered the 1980s with close-to-trend output growth (Figure 1), an unemployment rate around 6per cent, and core consumer price inflation around 8percentperannum (Figure 2) — with the last of these outcomes a legacy of inappropriately expansionary macroeconomic policies, as well as the OPEC oil shocks, of the 1970s.1
Australia joined the worldwide recession in the early 1980s, but the Australian recession was exacerbated by both a serious drought, which reduced farm output by about one-quarter in 1982-83, and trade-union-inspired significant rises in real wages which preceded it. The unemployment rate, which had been 5per cent in 1981, rose sharply to 10per cent in 1983.
Figure 1: Real GDP growth and the output gap
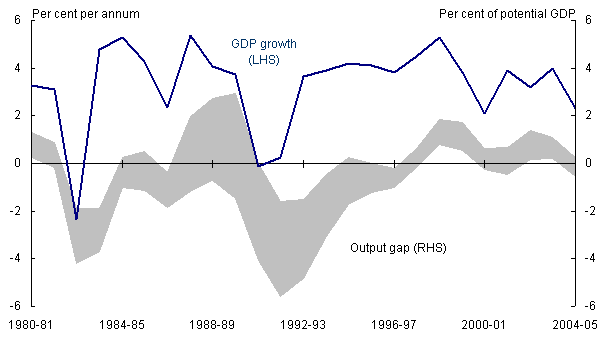
Note: The figure shows financial year averages of real GDP growth and a range of output gap estimates derived from three sources: the IMF, OECD, and estimates derived econometrically from a Phillips curve by Gruen, Robinson and Stone (2005).
Coming out of the recession, the economy grew strongly for the remainder of the decade. A ‘Prices and Incomes Accord’ between the then Australian Government and the trade union movement generated gradually declining real uni
t labour costs over this period, with the result that the economic upswing was accompanied by rapid employment growth and an unemployment rate which fell from 10per cent in 1983 to 6 per cent in 1989 (Figure 2).
Figure 2: Unemployment and inflation in Australia and the G7 countries
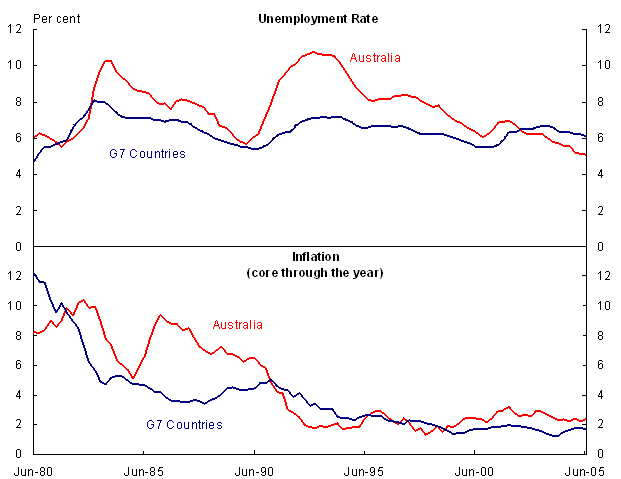
Note: Core inflation is non-food non-energy for the G7 countries, and weighted median for Australia, adjusted for the introduction of a goods and services tax in July 2000. Sources: OECD Main Economic Indicators and Reserve Bank of Australia.
The Australian dollar remained roughly stable for over a year after it was floated in December 1983, and then fell by almost 40per cent in trade-weighted terms from early 1985 to mid 1986. The proximate cause of this fall in the currency was a fall in Australia’s terms of trade (although the terms of trade fell by only about 15per cent over this time) and an associated widening of the current account deficit which, having averaged 4per cent of GDP over the first half of the 1980s, widened to 5per cent in 1985 and 5per cent in 1986. With relatively little currency hedging in place at the time, the large depreciation, along with the widening CAD, generated a rapid rise in Australia’s net foreign debt — from around 6per cent of GDP in June1981 to 32per cent five years later. This marked the beginning of widespread policy and community concern about the large Australian CAD and the rising stock of net foreign debt and other liabilities, a development that has had an important influence on fiscal policy for the subsequent two decades up to the present. We take up this topic in detail later in the paper.
The December1983 floating of the currency ushered in a period of significant financial deregulation which, along with strong economic growth and declining real unit labour costs, supported strong business investment over the second half of the 1980s. The decade ended, however, with the emergence of a sizeable bubble in commercial property prices in the business districts of many of Australia’s major cities.
Over the 1980s as a whole, CPI inflation averaged 8per cent per annum, although it was running well below this rate coming out of the early 1980s recession, and then rose sharply with the pass-through into consumer prices of huge import price rises generated by the collapse of the currency in the middle of the decade (Figure 2). In response to both the relatively high rate of CPI inflation, but also the large current account deficits, monetary policy was tight for most of the second half of the 1980s. This culminated in an overnight cash rate of about 18percent per annum in the second half of 1989, at a time when through-the-year core CPI inflation had declined to about 6per cent per annum.
This extremely tight monetary policy, which contributed to the bursting of the commercial property price bubble, combined with a worldwide economic recession, led to an Australian recession in the early 1990s which, although relatively mild in terms of output growth (Figure 1), was severe in its implications for the labour market. Unemployment rose sharply, from 6per cent in 1989 to 10per cent in 1992 (Figure 2).
Coming out of the recession, inflation fell precipitously, with core consumer prices rising by only 2per cent over the 1992 calendar year. Once inflation had been reduced to these rates, a medium-term flexible inflation targeting regime was introduced unilaterally by the Reserve Bank, with the aim of achieving CPI inflation of 2 to 3percent per annum on average over the course of the economic cycle (Stevens, 1999 and 2003). The inflation targeting regime was endorsed by the Labor Government of the day, and was formalised and strengthened in August 1996 in a ‘Statement on the Conduct of Monetary Policy’, issued jointly by the Treasurer of the newly elected Liberal-National Government and the incoming Governor of the Reserve Bank.
The nearly decade-and-a-half since the early 1990s recession has seen uninterrupted and reasonably steady economic growth, with unemployment falling virtually continuously, from 10per cent in 1992 to 5per cent currently. The average CPI inflation rate over this time has been close to the 2percentper annum midpoint of the inflation target, with through-the-year measures of core inflation almost invariably within one percentage point of this rate. Thus, in terms of outcomes for both inflation and the real economy, the medium-term flexible inflation targeting regime has achieved what it was designed to achieve.
Strong Australian productivity growth in the years since the early 1990s recession has also seen Australian GDP per capita rise more rapidly than the average for the OECD countries (Figure 3). This more-recent performance — a clear contrast to the experience of the previous several decades — has been interpreted by most, though not all, commentators as a dividend from wide-ranging reform, to both the microeconomic structure of the economy as well as the macroeconomic policy frameworks.2
Figure 3: Australian GDP per capita
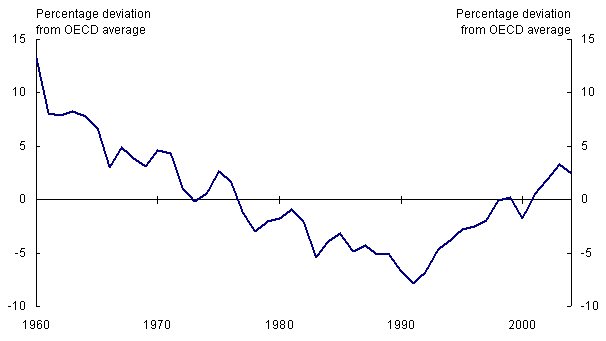
Note: OECD average is calculated for the 24 longest standing OECD member countries. Source: Groningen Growth and Development Centre and the Conference Board, August 2005.
Also of considerable note has been the resilience of the Australian macroeconomy over the period, in the face of sizeable shocks, particularly the 1997-98 Asian financial crisis, the worldwide economic downturn in the early 2000s, and an extended drought beginning in 2002-03.
At the time of the Asian financial crisis, the countries to which Australia sent half its exports were in recession. The Australian dollar depreciated significantly in response to this shock, partly cushioning the external sector. With the inflation-targeting regime having established credibility, the Reserve Bank saw no need to respond with higher policy interest rates to the depreciation and the associated expected pass-through of higher import prices into consumer prices. As a result, the Australian economy recorded strong growth through this period, despite the significant external shock (Figure 1).
Somewhat similarly, at the time of the worldwide downturn in 2001, a significant depreciation of the Australian dollar, combined with monetary policy easing, cushioned the effects of the external shock, and again real activity in the Australian economy was remarkably unaffected.
3. The evolution of fiscal policy
3.1 Fiscal outcomes
In the immediate aftermath of World War II, Australia had a large stock of government debt, amounting in gross terms to more than 100per cent of GDP. This ratio declined rapidly over the next several decades, mainly as a consequence of prudent fiscal policy until the mid1970s, but also because of a bout of unanticipated inflation in the 1970s. By 1980, the net debt of the general government sector had fallen to about 10per cent of GDP.3
There was a significant rise in the budget deficit associated with the early 1980s recession (Figure 4). While the automatic fiscal stabilisers played a role, both the OECD estimates of the structural fiscal balance shown in Figure4 and more recent estimates of the size of the automatic stabilisers in Australia by Girouard and Andr (2005) suggest that most of the rise in the deficit was a consequence of discretionary loosening.4
Figure 4: General government budget balance
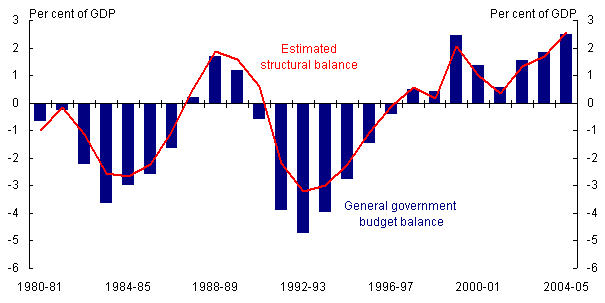
Note: The figure shows the general government underlying cash budget balance for all levels of government sourced from the Australian Treasury, and an estimate of the structural balance derived using OECD estimates of the cyclical budget contributions. The general government underlying cash balance to GDP ratio averaged -1.1 per cent in the 1980s, -1.4 per cent in the 1990s, and +1.6per cent thus far in the 2000s.
The rest of the 1980s saw significant fiscal consolidation which, as with the earlier loosening, owed more to discretionary fiscal tightening than to the operation of the automatic stabilisers.
The recession in the early 1990s interrupted the fiscal consolidation, and the budget again returned to sizeable deficits. The second half of the 1990s saw a repeat of the experience a decade earlier, with the budget returning to surplus in 1997-98 and the tightening again owing more to deliberate action than to the automatic stabilisers. In contrast to the 1980s experience, however, the general government sector has remained in surplus for the subsequent eight years to the present.
As a consequence of these cycles, the ratio of general government net debt to GDP in Australia rose to around 20 per cent in the mid 1980s and 25 per cent in the mid1990s. Since then, successive budget surpluses and the proceeds of asset sales have contributed roughly equally to the elimination of general government net debt for the combined levels of government by 2005, in obvious contrast to the net debt positions of most OECD countries (Figure5).
Figure 5: General government net debt in selected countries
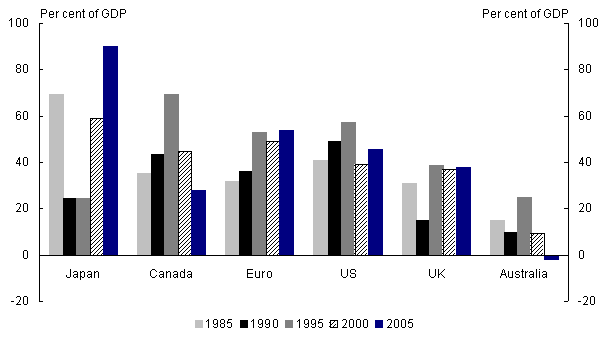
Note: Net debt figures are for all levels of government sourced from the OECD and Australian Treasury. Other than for Australia, data for 2005 are estimates. For Australia, data are on a financial year basis with the first reference year being 1987-88. By the end of 2004-05, Australian central government net debt was virtually zero, while the State and Territory Governments’ combined net debt position was negative.
In addition to its counter-cyclical role, fiscal policy has been influenced by two significant medium-term developments over the past two decades. The first development, relevant since the mid1980s, has been the large Australian current account deficits since that time, and the associated build-up of net foreign liabilities. The second development, which entered the public debate more recently, has been the realisation that the ageing of the population and the continuing provision of public health services are likely to put significant pressure on government finances in the years ahead.
It is to these two developments that we now turn.
3.2 The current account deficit
Over the quarter-century from 1959-60 to 1983-84, the Australian current account deficit averaged 2per cent of GDP. Over the subsequent two decades to 2004-05, however, it has cycled between about 2 and 7 per cent of GDP and averaged 4per cent of GDP (Figure 6). Despite the significant fiscal consolidation over these two decades and the elimination of general government net debt by the combined levels of government, there has been no clear sustained change, either increase or decrease, in the ratio of the CAD to GDP over this time. As a consequence, Australia’s net foreign liabilities have risen from about 30per cent of GDP in the mid 1980s to about 60per cent currently. The sustained fiscal consolidation since the mid1990s has, however, left the public sector with almost no foreign debt, so that virtually the entire current net stock of Australia’s foreign debt is owed by the private sector (Figure6).
Given the widespread interest in the US CAD, Figure7 shows a comparison of the US and Australian CADs from the perspective of national saving and investment. While both Australian national saving and investment have been higher than their US counterparts over the past quarter-century, the difference in national saving rates has been particularly pronounced in the past few years. The recent Australian national saving rate is close to its quarter-century average, while the recent US saving rate is much lower than its quarter-century average — which, in large part, is a consequence of the significantly different recent fiscal positions in the two countries (as well as evidence of a lack of a complete private-sector Ricardian offset to changes in government fiscal positions).5
Figure 6: Balance of payments and net foreign liabilities
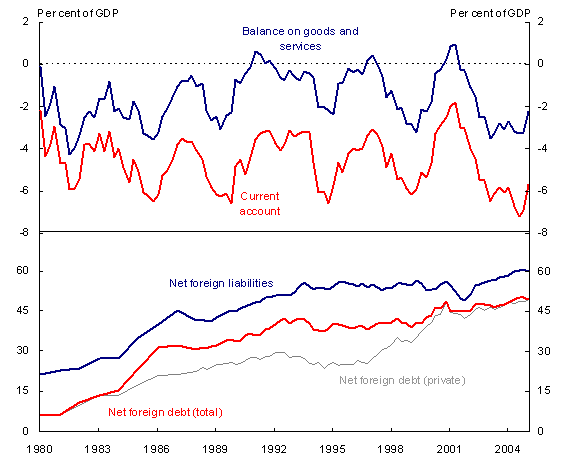
Note: The trade and current account data exclude gold transactions by the Reserve Bank of Australia.
Source: Australian Bureau of Statistics and Reserve Bank of Australia.
Over the past two decades, the Australian CAD and the associated rise in net foreign liabilities have been the source of much commentary. From around the mid 1980s to the end of that decade and into the 1990s, there was a broad consensus — encompassing the whole political spectrum, and shared by policy makers, economic commentators, business leaders and the wider community — that the large CAD and the growing stock of foreign liabilities represented the most serious economic problem facing Australia.6
Figure 7: National saving and investment for Australia and the United States
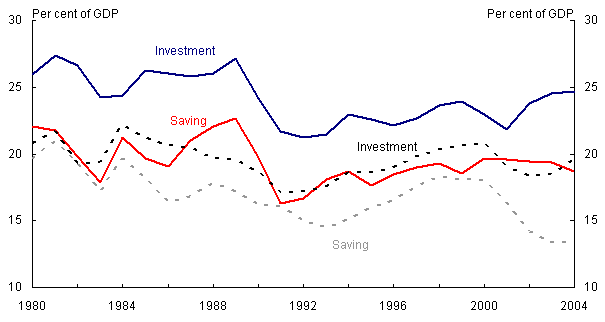
Note: Dashed lines are for the United States; full lines for Australia. Sources: IMF and Australian Bureau of Statistics.
Worsening assessments of Australia’s credit worthiness by the two main international credit rating agencies, Moody’s and Standard and Poor’s, added to the general level of concern. Australian Government debt had long been rated AAA by both organisations. Despite the fiscal consolidation in the second half of the 1980s, both agencies twice lowered the long-term foreign currency debt rating of the Australian Government (to Aa2 and AA) at that time.
Towards the end of the 1980s, however, the idea that large current account deficits and the associated build up of foreign liabilities were matters for public-policy concern faced an intellectual challenge. In the Australian context, the challenge was mounted primarily by Makin(1988), Pitchford(1989) and Corden(1991). Using the accounting identity linking the current account deficit to the excess of investment over saving in the private and public sectors as an organising device, these authors argued that private-sector investment and saving decisions were made by consenting adults who would reap the benefits or incur the costs of those decisions (absent any relevant externalities from their decisions). They further argued that public-sector decisions, and the resulting fiscal balance, should be judged on their own merits, rather than in terms of their influence on the current account. If large current account deficits were a symptom of distortions in the economy, the distortions should be tackled at their source, rather than providing a justification for using monetary or fiscal policy to influence them. Large current account deficits should be presumed to be neither good nor bad.
When these ideas were first presented, they were treated as academic in the pejorative sense of the word. But they gr
adually became more influential. Although some commentators continued to disagree with their policy implications, the debate was increasingly conducted in the terms in which it had been laid out by those arguing for the consenting-adults view.
While an increased vulnerability to external shocks is a possible externality from private-sector investment and saving decisions that have collectively raised Australia’s stock of net foreign liabilities, thus far there is little evidence that Australia’s vulnerability has been raised. On this point, the changing assessments of the international credit rating agencies, Moody’s and Standard and Poor’s, are of interest. Having downgraded Australian Government debt twice in the 1980s, both agencies returned these ratings to AAA by 2003. The statements accompanying the re-ratings suggest that by that time both agencies viewed Australia’s strong fiscal record and the resilience and flexibility of the economy as more important developments than the continuing rise in foreign liabilities.
It is also of interest that the historical record does not appear to contain any industrial-country examples of large CADs or stocks of net foreign liabilities having caused domestic economic downturns (except via contractionary domestic policy responses to the large CADs). Furthermore, when sharp contractions in industrial-country CADs have occurred, they appear to have been explained by domestically sourced shocks or changes to foreign demand for exports, rather than by difficulties associated with the external financing of the CAD (Debelle and Galati, 2005).7 Of course, the absence of such examples from the historical record does not imply that they could not occur in the future. But it does imply that capital markets have thus far treated the build up of foreign liabilities in industrial countries very differently than in developing countries. This, in turn, is related to the depth of financial markets in industrial countries, including the capacity to borrow internationally in the domestic currency and use derivative markets to hedge foreign-currency risk and thereby avoid significant mis-matches in the currency denomination of their foreign debts.8
A further issue of relevance to the consenting-adults view of the CAD is the possibility that a rising stock of foreign liabilities raises the cost of international borrowing. Standard portfolio-balance theory leads us to expect some rise in borrowing costs as net foreign liabilities rise. Figure 8 shows real long-term interest differentials between Australia and the G3 countries over the past quarter-century. The likely explanation for the relatively high Australian real yields in the early 1990s, and their subsequent fall, is that markets took a long time to be convinced that the step-down in Australian inflation at that time would be sustained (an explanation that accords with the cross-country empirical evidence of Orr, Edey and Kennedy, 1995).
Figure 8: Real long-term interest differentials
Australia versus US, Japan and Germany(a)
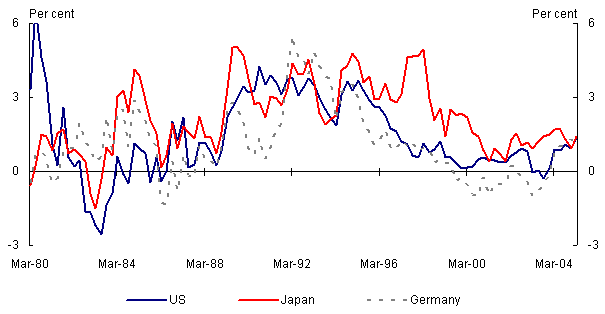
(a) 10-year government bond yields deflated by core consumer price inflation over the previous year in each country. Australian core consumer prices are the weighted median adjusted for the introduction of the GST in September quarter 2000. Source: Reserve Bank of Australia and DataStream.
More recently, however, real long interest differentials have been small. Over the five years to the March quarter 2005, Australian real long bond yields averaged 1.2percentage points above those in Japan, 0.5percentage points above those in the US, and 0.1percentage points below those in Germany. Over the same five-year period, the average difference between Australian and US government CPI-indexed long bonds has been 0.6percentage points. While Japanese bond yields may have been unusually low because of the parlous state of the Japanese economy over this time, the other three average differentials suggest that, if there is currently a risk premium on Australian long bonds, it is a fairly small one.9
A further perspective on this issue is presented in Figure 9, which shows the difference between Australian and US AAA-rated firms’ borrowing costs in the US capital market. While on average Australian firms pay an interest rate premium, this premium has averaged only about 0.4per cent perannum over the past five years.
Figure 9: Difference between Australian and US firms’
borrowing costs in the US capital market
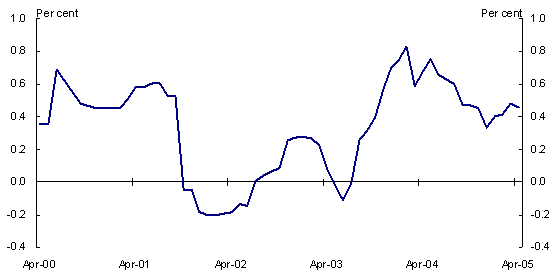
Note: The figure shows the difference between the centered seven-month moving-average yield on US-dollar floating-rate debt issued by AAA-rated Australian and US firms in the US capital market. Data are sourced from the Reserve Bank of Australia and Bloomberg.
One more observation on Australia’s external position seems apposite. For net foreign liabilities to remain at their current ratio to GDP of 60per cent requires that Australia run an average goods and services trade surplus in future of about toper cent of GDP. (This number rises gradually as the ratio of net foreign liabilities to GDP rises — see Appendix for details.) Australia has run goods and services trade surpluses for only brief periods over the past quarter-century (Figure 6). Nevertheless, the requirement to run average surpluses of to per cent of GDP in future does not appear too onerous an adjustment task for the economy, given the size of the shares of exports and imports (exports have averaged 20per cent of GDP and imports 21per cent over the past five years).
To conclude this section, the current account debate in Australia has never completely gone away, but its intensity has gradually subsided. There appear to be scant signs of heightened vulnerability to external shocks as a result of increasing net foreign liabilities in Australia’s recent economic performance or in current financial prices. While financial markets could presumably change their collective view about Australia’s vulnerability at some time in the future, it seems likely that the wide-ranging reforms to the economy have reduced this vulnerability relative to what it would otherwise have been. The consenting-adults view of the CAD, initially derided as academic and irrelevant, has gradually become more influential. Although it remains too early to pass a definitive verdict on it, we can at least say that Australia’s impressive economic performance over the two decades of high CADs has been kind to the consenting-adults view.
Finally, whatever one’s perspective on this debate, it remains clear that for governments of both political persuasions the sustained high CADs have provided continuous strong motivation for fiscal restraint since the mid 1980s.
3.3 Ageing and public health costs
In common with most developed countries, Australia faces a pronounced ageing of its population driven by declining fertility and mortality rates. The proportion of people aged 65 and over is projected to more than double over the next few decades with significant implications for economic growth and government finances.
These issues have been discussed in Australia for a long time.10 Early estimates suggested, however, that the impact of ageing on the economy and government finances would be moderate and this, combined with the un
certainty inherent in projections over such long time horizons, led some to conclude that the fiscal implications of ageing were relatively minor and that no specific policy response was required.
A more sobering perspective was provided in the National Commission of Audit report on government finances commissioned by the Australian Government in 1996. The report argued that the fiscal impact of ageing and the provision of public health services could be substantial, and that the Government should implement measures to reduce the potential for longer term age-related funding increases or, alternatively, begin to provision for them.
It was not until the release of the Government’s Intergenerational Report (IGR) in May 2002, however, that these issues generated widespread public interest. The forty-year projections contained in the IGR assume a continuation into the future of past trends in age-and-gender specific labour force participation rates. They imply that population ageing will reduce the aggregate labour force participation rate for the 15+population from around 64percent currently to below 56per cent by 2040. Although the Australian population is projected to continue to grow, due to both natural increase and immigration, the declining aggregate participation rate translates into a projected slowing of annual real GDP growth from its average of around 3percent over the past two decades to less than 2percent by 2040, only slightly above the assumed 1per cent trend rate of labour productivity growth.
Government finances are also projected to come under increasing pressure over the projection period. Assuming no change to government policies and a constant ratio of tax revenue to GDP, the IGR projects a reduction in the Australian government’s primary budget balance from surpluses of around 1per cent of GDP currently to a deficit of about 5per cent of GDP in 2041-42 (Figure10).11
Figure 10: Projected Australian government primary budget balance
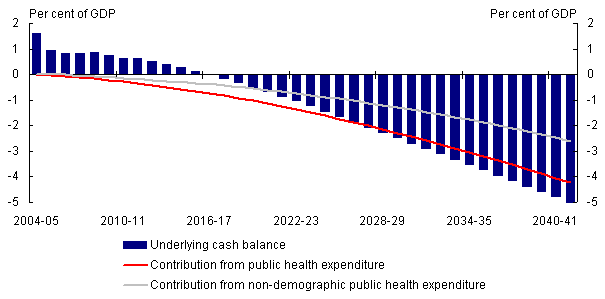
Note: The first five years of the projection are based on the Final Budget Outcome for 2004-05 and the forward estimates in the Australian Government’s 2005-06 Budget. Beyond that, the projections are of the primary budget balance from the 2002-03 Intergenerational Report. Estimates of non-demographic health expenditures are an average of the two estimates presented in Gruen and Garbutt (2004).
Rising public health costs account for most of this projected deterioration in the primary budget balance. Of this, more than half is attributable to non-demographic health pressures, including the (presumed) invention of improved, but more expensive, medical technologies and drugs, as well as the luxury-good nature of health services, which leads the share of expenditure devoted to health services to rise as community living standards rise, even with unchanged relative prices.
4. The development of a medium-term framework for fiscal policy
Australia’s fiscal policy framework has evolved considerably over the past quarter-century, in large part in response to the medium-term influences discussed above.
Although the Government of the day did not embrace the idea of a medium-term fiscal framework, the first medium-term fiscal rules were introduced in the mid 1980s. In its 1985-86 Budget, the Australian Government set out the ‘trilogy’ commitments, which committed the Government to:
- not raise tax revenue as a proportion of GDP in 1985-86 and over the [3year] life of the Parliament;
- not raise government expenditure as a proportion of GDP in 1985-86 and over the life of the Parliament; and
- reduce the budget deficit in dollar terms in 1985-86 and as a proportion of GDP over the life of the Parliament.
The trilogy commitments provided medium-term fiscal constraints within which annual budget policy could be framed. The emphasis was on restraining government expenditure, so that borrowing would be limited without raising the tax burden.
These fiscal rules were motivated primarily by the desire to boost public saving in response to the mid 1980s emergence of large CADs. The arguments that large CADs were a cause for public-policy concern and that fiscal policy had a role to play raising national saving were expressed clearly, and repeatedly, in the Government’s budget documents at that time.
In the broad, the trilogy commitments were achieved.12 The Australian Government reigned in spending and the budget deficit of around 3 per cent of GDP in 1983-84 was converted to a surplus of nearly 2per cent five years later.
The principles of the trilogy commitments were maintained, at least in broad form, throughout the remainder of the 1980s. With the onset of the early 1990s recession, focus shifted toward the immediate need for fiscal policy to support economic recovery. Even in the depths of the recession, however, the case was made that, once the economy recovered, ‘fiscal policy [could] then resume its important medium term role of increasing national saving and reducing recourse to foreign financing of domestic investment’ (Commonwealth of Australia, 1992, p 2.59).
With the return of both output and employment growth in 1993, the case for improving the Government’s finances was argued forcefully in the FitzGerald Report on national saving, commissioned by the Australian Government (FitzGerald, 1993). The report took as its starting point the observation that Australia’s national saving had fallen to its lowest level since Federation in 1901, except in times of world war and the Great Depression. Expressing concern at this outcome given Australia’s already high foreign debt and CAD, the report made the case that ‘the greatest scope for raising … national saving lies in the public sector. A concerted effort to strengthen the national public sector fiscal position is thus one of the major economic imperatives for Australia in the years ahead’ (FitzGerald 1993, p 16).
The response of the Labor Government of the day to the FitzGerald report was to commit itself, in the 1993-94 Budget, to reduce the budget deficit from an estimated 3 per cent of GDP in 1993-94 to around 1 per cent of GDP by 1996-97. In the event, the Labor government was replaced by the Liberal-National Government in March 1996. The budget outcomes were deficits of 2 per cent of GDP in 1994-95, 2per cent in 1995-96 and 1per cent in 1996-97.
The incoming Liberal-National Government formalised its approach to fiscal management in the Charter of Budget Honesty, which provides a framework for the conduct of fiscal policy and fiscal reporting. Although the Charter was not passed into legislation until 1998, it formed the basis for government fiscal management from 1996 onwards.
The Charter imposes a formal requirement on the Australian government to set out and report against a medium-term fiscal strategy, which is required to be based on ‘principles of sound fiscal management’. These principles require fiscal policy to have regard to: government debt and the management of financial risks; the state of the economic cycle; the adequacy of national saving; the stability and integrity of the tax base; and equity between generations.
The medium-term fiscal strategy has a primary objective as well as a number of supplementary objectives. The primary objective is to maintain budget balance, on average, over the course of the economic cycle. The supplementary objectives are to maintain budget surpluses over the Budget year and the three subsequent forward-estimate years while growth prospects are sound; not increase the overall tax
burden from 1996-97 levels; and improve the Australian Government’s net worth over the medium to longer term.13
Both the explicit medium-term focus and the language in which the strategy is cast took as their model the medium-term inflation target for monetary policy. By 1996, the inflation targeting regime was seen as a successful innovation, which had been strengthened by the new government when it issued the ‘Statement on the Conduct of Monetary Policy’ jointly with the Reserve Bank. It seemed a logical next step to put fiscal policy on a similar footing, with the expectation that similar benefits in terms of credibility and sustainability would be generated.
As had been the case a decade earlier, concern about the CAD was the primary reason advanced for the fiscal strategy. The 1996-97 Budget put the argument in these terms: ‘the only sustainable solution to our high structural CAD is to boost significantly our level of national saving. Raising public sector saving and thereby, over time, national saving, is the primary objective of the Government’s medium term fiscal consolidation strategy’ (Commonwealth of Australia, 1996, p1-9).
The language used in the fiscal strategy, to maintain ‘budget balance, on average, over the course of the economic cycle’ and ‘budget surpluses while growth prospects are sound’ leaves much room for discretion — although it is constrained discretion in the sense of Bernanke et al (2001). The size of the ‘budget surpluses while growth prospects are sound’ consistent with the strategy is not specified, nor is there guidance as to the precise economic circumstances in which the budget should be expected to be in deficit. There is a general presumption that monetary policy plays the primary counter-cyclical role, with fiscal policy playing a secondary and supportive role, although this presumption has clearly not been tested in an economic downturn.
The discretion inherent in the Australian fiscal strategy stands in contrast to the stricter fiscal rules in many countries. In particular, there is no attempt to precisely date the economic cycle as part of the Australian fiscal strategy, in contrast to the UK fiscal strategy, and the strictures imposed by the European Growth and Stability Pact clearly do not apply (see Wyplosz, 2005, for a discussion of fiscal rules).
Of course, since much of the language is the same, the lack of precision and the room for discretion are also features of the Australian inflation target. When the inflation target was initially introduced in the early 1990s, the lack of precision, and particularly the ‘on average over the course of the economic cycle’ phrasing without any explicit dating of the economic cycle, was widely criticised, including by the OECD and IMF, especially when comparisons were drawn with the New Zealand inflation target which was cast in much more precise language and was regarded at the time as world-best practice.
Over time, however, this assessment changed. The discretion inherent in the Australian inflation targeting regime was seen to be used sensibly — in the Asian financial crisis, for example. The flexibility of the regime was increasingly seen as a benefit, not a cost, and was subsequently emulated by others including New Zealand.
A similar comment could be made about the Australian fiscal policy framework, especially given the fiscal outcomes in the years since the framework was introduced. Of course, discretion works well only when it is used sensibly. It is arguable that the flexibility and extent of discretion implicit in the Australian fiscal framework might not lead to such favourable outcomes in different countries with different economic histories and political institutions.
A fiscal policy framework that allows for discretion is likely to work best when there is a high degree of transparency (a statement that is also true for flexible inflation-targeting regimes). The Charter of Budget Honesty imposes a number of reporting requirements on the Australian government to enhance transparency, including the requirement to publish a pre-election economic and fiscal outlook report once a Federal election has been called, and an Intergenerational Report every five years to assess the long-term sustainability of current Government policies.14
As discussed earlier, the first IGR, issued in May 2002, played an important role in broadening the Government’s fiscal objectives. With the rising projected costs of ageing and public health services forming the centerpiece of this IGR, the Australian fiscal policy debate has increasingly been cast in terms of intergenerational equity and fiscal sustainability.
The desire to provide a fiscal policy response to these projected rising costs was expressed by the Government in its 2005-06 Budget. ‘Sustainable fiscal policy is more than just prudent reduction of past debts. It involves managing all elements of the balance sheet … and a forward-looking strategy to address the looming fiscal pressures yet to affect Government finances’ (Commonwealth of Australia, 2005, p 2-13).15
With Australian central government net debt virtually eliminated, the Government established an asset fund (the ‘Future Fund’) in 2005 to meet the future payments associated with the accruing superannuation entitlements of current and former public-sector employees, thereby freeing up resources in the future when fiscal pressures associated with health and ageing are expected to emerge.
The asset fund will be established using past budget surpluses, which are currently held in term deposits with the Reserve Bank, and supplemented from future budget surpluses and possibly the proceeds of future asset sales. Although the details are still to be determined, the asset fund will be managed by a Board operating independently of Government, with an expectation that it will invest across a wide range of both domestic and foreign financial assets. Earnings on the Fund assets will be reinvested in the Fund, rather than being available to meet recurrent government expenses. The fiscal strategy remains budget balance on average over the cycle, but the relevant budget aggregates now ‘raise the bar’ for budget balance by excluding the earnings from the Fund assets. Quarantining these earnings therefore represents a structural tightening of fiscal policy which, depending on the size of subsequent contributions to the Fund, could be in the order of to percent of GDP within a few years.
5. Conclusions
Fiscal policy outcomes and the framework in which fiscal policy has been set have evolved significantly in Australia over the past quarter-century. This evolution has been driven, in large part, as a response to two main developments in the Australian economy.
The first development, relevant over the two decades since the mid 1980s, has been the emergence of sizeable current account deficits. Notwithstanding the extended periods of fiscal restraint over this two-decade period and the elimination of general government net debt by the combined levels of government, there has been no obvious sustained change in the ratio of the current account deficit to GDP over this time. There has, however, been a lively debate about whether the current account deficit should be of public-policy concern. Our assessment of this debate is that the consenting-adults view of the current account, initially derided as irrelevant, has become much more influential. And we would also argue that, while it is too early to present a final verdict, the experience of the past two decades has been kind to the consenting-adults view.
The second development, which has been of growing importance in more recent years, has been the project
ed fiscal implications of ageing and future public health costs, which were brought to widespread public attention in the Australian context in the May 2002 Intergenerational Report.
The Australian fiscal framework has evolved in response to these developments. In its modern incarnation, it provides guiding principles in the form of a primary objective ‘to maintain budget balance, on average, over the course of the economic cycle’, as well as a number of supplementary objectives. In common with the Australian inflation target from which some of the language was taken, the fiscal framework provides constrained discretion for fiscal policy actions, which is in obvious contrast to the strict rules in the European Stability and Growth Pact, for example.
This constrained discretion has worked well in the Australian context judging by the fiscal policy outcomes in the years since the framework was introduced. As the recent introduction of the Future Fund makes clear, the framework is continuing to evolve in response both to Australia’s extremely strong fiscal position and to evolving perceptions of likely future fiscal pressures.
6.References
Bernanke, B S, Laubach, T., Mishkin, F S and Posen, A S (2001), Inflation Targeting: Lessons from the International Experience, Princeton University Press.
Commonwealth of Australia (1996), Budget Paper No 1, Budget Strategy and Outlook 1996-97, Canberra, AGPS.
Commonwealth of Australia (1992), Budget Paper No 1, Budget Statements 1992-93, Canberra, AGPS.
Commonwealth of Australia (2002), Budget Paper No 5, Intergenerational Report 2002-03, Canberra, AGPS.
Corden, W M, (1991), ‘Does the Current Account Matter? The Old View and the New’, Economic Papers, 10, 1-19.
Debelle G and Galati G (2005), ‘Current account adjustment and capital flows’, BIS Working Paper, 169.
Economic Planning Advisory Council (1994), Australia’s Ageing Society, Background Paper No. 37, Canberra, AGPS.
Eichengreen B and Hausmann R (1999), ‘Exchange Rates and Financial Fragility’, in New Challenges for Monetary Policy, Federal Reserve Bank of Kansas City, 329-368.
FitzGerald, V W (1993), National Saving: A Report to the Treasurer, Canberra, AGPS.
Freund, C L (2000), ‘Current Account Adjustment in Industrialized Countries’, International Finance Discussion Paper No. 692, Board of Governors of the Federal Reserve System.
Girouard, N and Andr, C (2005), ‘Measuring Cyclically Adjusted Budget Balances for OECD Countries’ OECD Economics Department Working Paper No. 21.
Groningen Growth and Development Centre and The Conference Board (2005), ‘Total economy database’, August, University of Groningen, viewed 1November 2005, www.ggdc.net.
Gruen, D, and Garbutt, M (2004), ‘The Long Term Fiscal Implications of Raising Australian Labour Force Participation or Productivity Growth’, Australian Treasury Working Paper 2004-01.
Gruen, D, Robinson, T, and Stone, A. (2005), ‘Output Gaps In Real Time: How Reliable Are They?’, Economic Record, 81(252), 6-18.
Gruen, D and Shrestha, S (2000), The Australian Economy in the 1990s, Conference Proceedings, Reserve Bank of Australia.
Gruen, D and Stevens, G (2000), ‘Australian Macroeconomic Performance and Policies in the 1990s’, 32-72 in The Australian Economy in the 1990s, Reserve Bank of Australia, Gruen, D. and Shrestha, S. eds.
Lane, P R, and Milesi-Ferretti, G M (2001), ‘Long-Term Capital Movements’, NBER Working Paper, 8366.
Makin, A J (1988), ‘Targeting Australia’s Current Account: A New Mercantilism?’, Economic Analysis and Policy, 18(2), 199-212.
McDonald, I (2005), ‘Intergenerational Equity’, Agenda, 12 (1), 3-18.
National Population Inquiry (1975), Population and Australia: A Demographic Analysis and Projection, Vol. 1 and 2, Canberra, AGPS.
Nelson, E (2005), ‘Monetary Policy Neglect and the Great Inflation in Canada, Australia, and New Zealand’, International Journal of Central Banking, May, 133-179.
Orr A, Edey, M, and Kennedy, M (1995), ‘The Determinants of Real Long-Term Interest Rates: 17 Country Pooled-Time-Series Evidence’, OECD Economics Department Working Paper 155.
Pitchford J (1989), ‘A Sceptical View of Australia’s Current Account and Debt Problem’, The Australian Economic Review, 86, 5-14.
Productivity Commission (2005), Economic Implications of an Ageing Australia, Research Report, Canberra.
Reserve Bank of Australia (2002), ‘Australia’s Foreign Currency Exposure and Hedging Practices’, Reserve Bank of Australia Bulletin, August, 56-60.
Social Welfare Policy Secretariat (1984), The Impact of Population Changes on Social Expenditures: Projections from 1980-81 to 2021, Social Welfare Policy Secretariat, Canberra.
Stevens, G (1999), ‘Six Years of Inflation Targeting’, Reserve Bank of Australia Bulletin, May, 46-61.
Stevens, G (2003), ‘Inflation Targeting: A Decade of Australian Experience’, Reserve Bank of Australia Bulletin, April, 17-29.
Wyplosz (2005), ‘Fiscal Policy: Institutions verses Rules’, National Institute Economic Review, No. 191, January, 64-78.
Appendix — The arithmetic of accumulating liabilities
Ignoring valuation effects from possible changes in the value of the Australian dollar on the stock of net foreign liabilities (NFL), the relationship between NFL foreign liabilities in years t and t+1, and the CAD in year t is ![]() .16
.16
Dividing both sides by GDP in year t, with g the growth rate of nominal GDP and lower case letters defining ratios to GDP, we have ![]() which implies that
which implies that ![]() , and therefore that nfl stabilises at
, and therefore that nfl stabilises at ![]() , for cad and g constant through time.
, for cad and g constant through time.
If the average nominal return on net foreign liabilities is r, then the net income deficit, nid, will be ![]() , and the goods and services trade surplus, gss, consistent with a stable nfl will be
, and the goods and services trade surplus, gss, consistent with a stable nfl will be ![]() .
.
With net foreign debt currently accounting for over four-fifths of net foreign liabilities (Figure 6) it seems reasonable to assume r is, say, 6percentperannum. Assuming nominal GDP growth g=0.05 (a plausible assumption over the next decade or so, given population ageing), this requires a goods and services trade surplus of (0.06–0.05)x0.60=0.0060, or 0.6per cent of GDP.
1 Nelson (2005) presents a recent perspective on the inappropriately expansionary nature of monetary policy in Australia (and in New Zealand and Canada) in the 1970s.
2 The contributions by Bean, Dowrick, Forsyth, Gruen and Stevens, Snape and Quiggin in Gruen and Shrestha (2000) give a good sense of the range of opinions on this issue.
3 Data issues complicate comparisons over time. Commonwealth Government Securities on issue amounted to more than 100per cent of GDP in 1950, but by 1980 this ratio had fallen to 25per cent of GDP. We use the alternative figure for general government net debt (or net financial liabilities) because it is one of the measures used by the OECD to make cross-country comparisons of government indebtedness. The general government sector is a consolidation of the central, state and local governments, and the social security sector (which doesn’t exist as a separate sector in Australia). We use the terms ‘Australian government’ and ‘Australian general government sector’ when referring to the central government alone. Net debt includes all financial liabilities (except unfunded government pension or superannuation liabilities) less financial assets. For a number of countries, including Australia, equity holdings in businesses and public trading enterprises are not included in this measure. Therefore, the use of the proceeds from the sale of public trading enterprises to retire government debt reduces general government net debt. Adjusting the Australian figures for the proceeds of these sales changes the numbers somewhat, without making much difference to the overall qualitative picture.
4 Girouard and Andr estimate that widening the output gap by 1per cent of GDP reduces the budget balance in Australia by 0.4per cent of GDP. The range of estimates shown in Figure1 imply a widening of the output gap by between 2.8 and 3.5percent of GDP from 1981-82 to 1983-84, suggesting that the automatic stabilisers would have raised the deficit by between 1.1 and 1.4 per cent of GDP, compared with the actual rise in the general government deficit over that time of 3.4per cent of GDP.
5 At the end of 2004, the net foreign liabilities to GDP ratios were 60percent for Australia and 21per cent for the US. Over the year to the June quarter 2005, the two countries’ CAD to GDP ratios were similar; 6 per cent for Australia and 6per cent for the US. The goods and services deficit (GSD) to GDP ratios were quite different, however, at 3per cent for Australia but 5per cent for the US, which primarily reflects very different net income flows. The Australian net income deficit was about the same size as the GSD while the US had a small net income surplus. (For the US, a deficit on unilateral current transfers [transfers paid with nothing provided in return; for example, foreign pension payments or aid flows] explains why the CAD was larger than the GSD despite the small net income surplus.)
6 Two newspaper headlines give a flavour of the times: ‘Scary Arithmetic in our [Foreign] Debt Figures’, The Sydney Morning Herald 17 July 1989; ‘Australia’s [Foreign] Debt Hovering on the Cliff-Face of Crisis’, Australian Financial Review 21September 1989. And not to forget Macquarie Bank’s November 1989 contribution to the debate, ABoiling Frog: Australia’s Economic Challenge, a booklet that argued that Australia’s current account problem could be likened to that of a frog immersed in initially cold, but gradually warming, water. Failing to realise the impending danger, the frog is eventually boiled.
7 In a widely cited paper, Freund (2000) studies twenty five industrial-country examples of sharp falls in the CAD and finds that these episodes usually also involve significant domestic slowdowns. Her results cannot address causality, however, and appear consistent with the domestic slowdown arising for reasons unrelated to funding the CAD, and then being at least partly responsible for the falls in the CAD. The single Australian episode in her sample, in the years following 1989, certainly appears to follow this chain of causation. Nevertheless, as a general proposition, the cyclical behaviour of the CAD may be of interest to policy makers because it can provide confirming evidence of growing imbalances in the domestic economy. In the late 1990s in the US, for example, the inflating stock market bubble was being fuelled by both domestic and foreign investors, and the rapidly rising US CAD reflected the extent to which foreign money was being invested in the stock market at that time.
8 On these issues, see Eichengreen and Hausmann (1999). In Australia’s case, the latest available data suggest that about three-quarters of foreign-currency denominated debt is hedged back to Australian dollars. As a consequence, for the economy as a whole, foreign-currency denominated assets significantly exceed foreign-currency liabilities, despite the large stock of net foreign liabilities (Reserve Bank of Australia, 2002).
9 The low level of Australian government debt should offset the interest-rate effects of the large stock of net foreign liabilities to some extent. It is interesting to note that the average real long-term yield differential between Australia and the US over the past five years is much smaller than would be implied by the ‘Real interest differential’ cross-industrial-country regressions reported in Tables 7 and 8 in Lane and Milesi-Ferretti (2001).
10 For early commentary, see reports of the National Population Inquiry (1975); Social Welfare Policy Secretariat (1984) and Economic Planning Advisory Council (1994).
11 Budget balances for State and local governments are also likely to be adversely affected. However, these impacts are projected to be relatively modest compared to those for the Australian Government (Productivity Commission, 2005).
12 Strictly speaking, not all of them were met. The ratio of tax to GDP rose temporarily later in the 1980s, although it returned to around its 1984-85 level by the end of the decade.
13 The government’s net worth (government assets less liabilities) is a more comprehensive measure of the government’s overall financial position than net debt because it includes non-financial assets, such as land and other fixed assets, as well as some financial assets and liabilities not captured in the government’s net debt measure (most notably for Australia, accrued employee superannuation liabilities). A supplementary objective in an earlier version of the fiscal strategy was to reduce Australian government net debt to 10per cent of GDP by 2000-01, rather than to improve net worth. This net debt objective was achieved ahead of schedule which, together with the introduction of accrual accounting, enabled the government to identify and focus on the larger subset of fiscal risks embodied in the concept of net worth.
14 In contrast to other fiscal documents, the pre-election economic and fiscal outlook report is released publicly by the public-service heads of the Treasury and Finance departments, not by the Government.
15 McDonald (2005), however, argues against a current fiscal response to the projected rising fiscal costs of ageing and public health services because future generations will likely be better off, and hence better able to afford to pay a higher share of their income in taxes, than the current generation.
16 As explained in the text, the latest data imply that foreign-currency denominated assets significantly exceed foreign-currency denominated liabilities for Australia as a whole. As a consequence, any depreciation that accompanied the process of stabilising the ratio of NFL/GDP would reduce the Australian-dollar value of the stock of net external liabilities, via valuation effects.