Downloads
Introduction
Thank you for the invitation to speak at this special event. It is a great pleasure to share a platform with my senior colleague from Japan's Ministry of Finance, Takeuchi-san.
Today I want to talk about some shared trends Australia and other advanced economies now face. These include slower productivity growth, ageing populations and related lower participation rates, which have been underway since at least the early 2000s. Wage growth and business investment have also been subdued in recent times. Some of these factors, and a period of extraordinary monetary policy after the Global Financial Crisis (GFC), have also resulted in historically low interest rates.
Outside of Japan, many of these developments began to manifest themselves in economic outcomes in advanced economies around the GFC. Disentangling long-term structural changes from the very unusual cyclical forces at play in recent times has been, and remains, very difficult. That said, for most advanced economies it is reasonable to assume that there are significant structural changes underway that will likely pose a challenge for some time to come and spill-over to Australia.
For Australia, disentangling these forces is made even more difficult because of the recent terms of trade cycle, which has been a significant historical event. As we are currently emerging from the tail end of that major cyclical event there is some cause for optimism. We expect that in Australia the cyclical element to the shared challenges I mentioned is likely to recede. In particular, we can expect the cyclical impacts of the negative income effect generated by falling commodity prices to abate.
International comparisons
Advanced economies are facing a number of challenges, some of which only became apparent after the Global Financial Crisis, while others had begun to play out well before it.
Slower productivity growth

Source: OECD
The first of these that I'll discuss is slower productivity growth.
Slowing productivity growth is something of a puzzle for many economists, with several competing hypotheses as to the causes of the reduction in recent times. These include that new technologies are less consequential for productivity than previous innovations, that there is a lag before the gains from new technologies are realised, or that we simply aren't measuring productivity properly. The decline in productivity growth has also coincided with a period of unusually weak business investment in many countries. Only recently have we seen more promising signs of stronger investment. Slow productivity growth internationally – and especially in the United States – will, if it persists, have implications for Australia's future productivity growth, because the frontier is expanding more slowly.
Slower productivity is weighing on potential growth in most advanced economies. So is population ageing, which is affecting workforce participation.
Low neutral interest rates

Source: McCririck & Rees (2017)2
Another recent trend across advanced economies has been the emergence of persistently low interest rates. In particular, there have been declines in the so-called neutral rate of interest.
The neutral rate of interest is the real policy rate required for GDP to grow at trend rates. Declines in this rate mean that cash rates have to go lower than they have historically needed to in order to close output gaps and generate inflation. Recent falls in the neutral rate of interest are a consequence of slower potential growth and heightened risk aversion.
The reduction in the neutral rate of interest raises questions for policy makers, as well as households and firms, as they adjust to the lower interest rate environment.
Annual average wage growth

Source: OECD
The last shared trend that I want to mention is the slowdown in wage growth across many advanced economies.
The extremely high rates of unemployment on either side of the Atlantic that followed the GFC were an obvious catalyst for this. But even now, with many advanced economies reaching or nearing 'full employment', wage growth remains weak compared to pre-GFC trends. As yet, it is unclear whether wage growth will pick up as labour markets tighten, or whether there are other structural factors at play.
The causes of this slow wage growth are complex and there do seem to be both cyclical and structural factors involved. Disentangling these factors is challenging. And we should be wary of assuming the same forces are at play in each country.
Australia and the terms of trade boom
At an aggregate level the Australian economy has not displayed the same characteristics as our major advanced economy trading partners. Despite the size of the decline in mining investment and commodity prices, output and employment growth have been sustained, albeit at lower rates than normal. We have not experienced a recession but some spare capacity in the labour market has emerged.
Below the surface, we do seem to see some similar trends here in Australia. Our economy has faced lower labour productivity growth over the past decade, though not the past five years. Our official interest rates are at historically low levels. Wage growth has been very slow and business investment has been weak, even outside mining. Our population is ageing.
We need though to exercise caution when making these comparisons.
Terms of trade

Source: OECD and ABS cat. no. 5204.0
First of all, endowments matter. This much is clear by comparing the terms of trade in Australia and Japan over recent decades.
From the early 2000s, Australia's terms of trade improved considerably as Japan's deteriorated. The reason was largely natural endowments. Australia is one of the world's largest exporters of bulk commodities, such as iron ore and coal, and an importer of manufactured goods. By contrast, Japan is an importer of bulk commodities and an exporter of manufactured goods.
Growing dependency ratio

Source: UN
Second, compared with most advanced economies, Australia's population is growing relatively fast and is relatively young.
One way of showing this is the dependency ratio. In each country depicted, the projected increase in the dependency ratio over coming decades means that a growing share of the population will be supported by a relatively smaller number of workers. This is an obvious issue in many advanced economies. Some emerging markets, notably China, are not far behind.
While our population is ageing, our relatively faster population growth, underpinned by positive net overseas migration, means that we are doing so more slowly than most other advanced economies.
US output gap

Source: FRED
A third way to distinguish Australia's situation from many other advanced economies relates to the 2007-08 Global Financial Crisis.
For many advanced economies, that was the most significant economic event in recent times – with many economies taking some time to emerge from deep recessions.
For instance, as this chart shows, since the crisis, the US economy has endured an output gap that has been the deepest and most persistent experienced since the Great Depression. And, even now, it is unclear how much spare capacity remains. The unemployment rate suggests there is minimal spare capacity, but wages growth suggests some spare capacity remains.
We know that the real effects of financial crises are persistent. And the events of 2007-08 were a very large financial crisis.
But for Australia, the most influential economic event of recent decades was not the global financial crisis.
Rather, the performance of Australia's real economy over the past 15 years has been dominated by the largest mining boom in our modern history.
Mining boom: initial income shock

Source: ABS cat. no. 5302.0
You will all be familiar with the terms of trade boom, the associated mining investment boom and the recent ramp up in our commodity exports.
But, as a reminder, rapid industrialisation and urbanisation in Asia, especially China, led to sharp increases in the demand for, and in turn prices of, commodities such as iron ore and coal – commodities for which Australia is a major exporter.
The resultant improvement in Australia's terms of trade had profound consequences for our economy.
First, it delivered a big income boost for resource companies.
Second, it led to an appreciation in the nominal exchange rate, which helped consumers and some industries by reducing import prices in Australian dollars, thereby increasing Australia's purchasing power. But it also made life harder for export- and import- competing industries that weren't beneficiaries of higher commodities prices – industries such as manufacturing, tourism and higher education.
Mining boom: Investment boom

Source: ABS cat. no. 5204.0
Higher commodity prices spurred an investment boom, as mining companies moved to increase output to take advantage of the higher demand for these commodities. This was a huge boom by modern standards. If we took the blue line back to 1960, you would see mining investment at around 2 per cent of GDP, rising to 3 per cent in a 'boom'. This time it peaked at 9 per cent of GDP.
As the chart shows, there was a noticeable lag between the lift in the terms of trade and the investment phase of the mining boom. This reflected a delayed realisation about the size and duration of the demand shock. It also reflected the scale and capital intensity of the mining sector, which meant a lot of investment was needed to meet soaring demand for bulk commodities, with many large scale mining projects taking years to build.
The resultant mining construction boom required a lot of inputs. Much of the capital equipment was imported from overseas. The workers and various intermediate goods and services required to install that capital were sourced from both the domestic market and offshore.
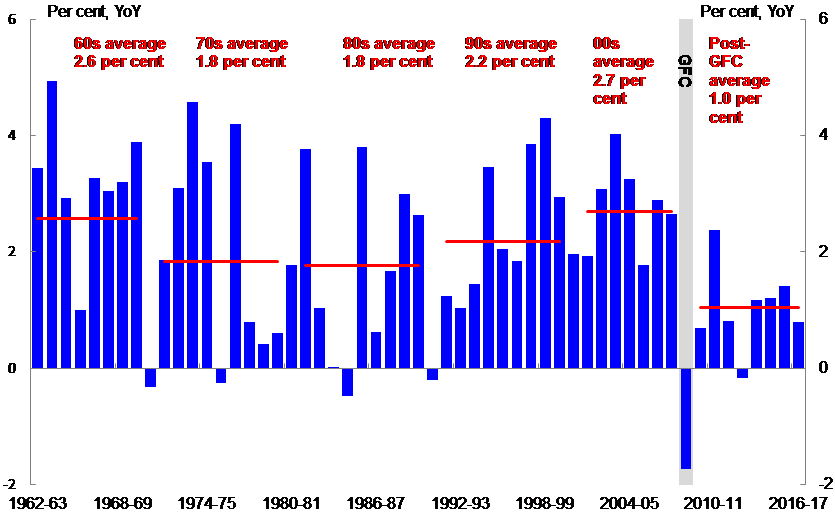
Employment growth

Source: ABS cat. no. 6202.0
The investment boom struck an economy with little spare capacity.
I want to focus more on the impact of the mining boom on wage growth and household consumption.
When mining investment boomed from around 2004-2005, Australia already had very low unemployment. This meant there was little, if any, excess labour supply to meet the increased demand for workers.
Demand for labour surged in the mining and construction industries, spilling into other industries in mining states. With supply limited, this increased demand for labour was met by short term flows as workers from interstate and overseas were lured by higher wages.
In this sense, the mining investment boom drew resources from other sectors of the economy. The result was strong growth in Australia's mining states, but relatively softer growth elsewhere.
A very important feature of both the upswing and downturn of the commodity cycle was the dispersion of wages growth across the economy. This helped reallocate resources but also helped damp the macroeconomic, employment and inflationary consequences of the mining boom. The labour market proved very flexible.
At the aggregate level, the real consumer wage(the blue line in the chart) – that is, wages relative to the prices that consumers pay for goods and services –has been largely flat since the peak in the terms of trade. This is also true of nominal unit labour costs. This is a very unusual event. We have to go back to the years following the recession of the early 1990s to find another example in Australia. This subdued period of consumer wage and labour cost growth has helped support the labour market through the downturn in commodity prices.
Real wages and labour productivity

Source: ABS cat. no. 5206.0 and Treasury
As you can see, throughout the boom the real producer wage – which is wages relative to the prices firms receive for their output – has continued to grow in line with productivity, at least until the very recent uptick in commodity prices.
One of the factors supporting the purchasing power of Australian income in the early stage of the boom was cheaper imports. This underpinned strong growth in the real consumer wage.
In the long run, the real consumer wage and the real producer wage would be expected to grow in line with productivity. But as the chart shows, the mining boom caused real consumer wages to grow much faster than productivity, supporting a rise in real per capita household consumption over the period – as this next chart shows.
Real household consumption growth per capita
Source: ABS cat. no. 5206.0, unpublished ABS data and Treasury
But since the terms of trade peaked in around 2011, growth in real consumer wages has flattened and per capita consumption growth has slowed markedly. We have some way to go in the cycle, so timing is uncertain. But we can reasonably expect that consumer wages and producer wages should eventually return to growing in line with productivity.
Consumer and producer wages

Source: ABS cat. no. 5206.0, National statistical agencies and Treasury.
US data is indexed to June 2006 as this is the starting point for this data.
Other commodity exporters have shared our experience. The four panels in the chart show two commodity exporters – Australia and Canada – alongside the US and Germany. You can see the effects of the deep recession in the US. Equally, you can see that consumer and producer wages in the US and Germany have grown at the same rate. While in Canada and Australia a wedge opened up during the terms of trade boom.
This comes back to my earlier point: endowments matter. As their economies adjust to the end of the mining boom, commodities exporters such as Australia are experiencing weak wage growth in part because the mining boom is unwinding. This chart also illustrates the proximate cause of the noticeable decline in the labour share of income in the United States, a phenomenon absent in Australia.
One last point on recent experiences in the labour market. In Australia, as in other advanced economies, the unemployment rate has become a less reliable indicator of labour market slack. There seem to be structural reasons for this: the larger share of part-time employment and greater flexibility, with employers adjusting hours rather than heads, are two possible factors. For this reason we in the Treasury have developed a labour market conditions index that takes into account a range of indicators. The index is set so that average conditions are zero. Recently this index has moved into positive territory – that is, labour market conditions are tighter than average.
Labour market conditions index

Source: Treasury3
As the negative income effect of the downside of the commodity price boom recedes, and as business investment starts to pick up, we can expect labour market conditions to tighten gradually and wage growth to improve as the economy transitions out of the mining boom and moves to broader based sources of growth.
Conclusion
Australia's economic experience in the past decade has differed significantly from most advanced economies. Output and employment growth have been sustained and our financial system has been resilient.
But there are similarities in a range of areas including demographics, productivity, weak business investment and wage growth that suggest some commonality of economic experience. Some of the trends that we are seeing globally have important structural elements. And while this is likely also to be the case in Australia there is reason to believe that the marked cyclical impact of the mining boom has also been an important factor. We should expect to see more normal economic outcomes in Australia as the commodity price cycle stabilises.
Still, we cannot be complacent about such an outcome. Ensuring that Australian maintains the conditions needed for a strong long-term growth path should remain a key focus of policy.
Thank you.
1 - I should like to thank Jazmine Smith and John Breusch for their considerable assistance drafting this speech.
2 - McCririck, R & Rees, D 2017. 'The Neutral Interest Rate', Bulletin, Reserve Bank of Australia.
3 - See: Grant, A, Gillies, W, Harris, R & Ljubic, M 2016. 'An Australian Labour Market Conditions Index', Treasury Working Paper, Treasury.