Assuming all parameters are known (β, δ and ξi), the framework described by (4) can be used to generate long-term projections of gross domestic product (GDP) growth for countries for which there is historical data and population projections of the working age population. In practice, the model’s parameters (β, δ and ξi) must be calibrated or estimated from available data and empirical studies. For the reference country, the framework also requires parameters describing the evolution of its trend productivity growth. This section reviews the data underlying the estimates of the model’s parameters and projections.4
Gross domestic product
Historic GDP is constructed using three sources which ensure the broadest possible coverage of economies for the projections, which total to 155. The three sources are: the International Monetary Fund’s (IMF) World Economic Outlook (WEO) database; the Conference Board’s Total Economy Database (TED); and Angus Maddison’s historical statistics (1 — 2008AD).
Real GDP growth rates are sourced from the IMF’s WEO, which closely match estimates from each country’s official statistics bureau. The level of real GDP is based on the 2008 estimate from TED, which uses 2011 US dollar price levels converted at purchasing parity using the Elteto, Koves and Szulc (EKS) methodology.5 In some cases, TED data is not available so the 2008 level of real GDP from Maddison is used instead. These growth and level data are combined to backcast and forecast the level of real GDP from 1980 to 2017. Where possible these data are backcast further to 1950 using growth rates from the TED and Maddison databases.
Chart 1: Historic real GDP
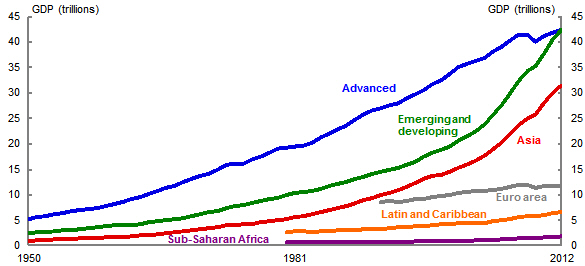
Source: Maddison (2010), Conference Board Total Economy Database (2012), IMF World Economic Outlook (April 2012), authors’ calculations.
Constructed real GDP levels for selected IMF groups/regions are shown in Chart 1.6 At the broadest level, world GDP is the sum of advanced and emerging/developing group GDP. Selected GDP subgroups shown in Chart 1 include: the euro area, which is part of the advanced group; Asia, which includes economies in the advanced and emerging/developing groups; and Latin America and the Caribbean, and Sub-Sahara Africa, which belong to the emerging/developing group.
Population
Global demographic estimates and projections are sourced from World Population Prospects (WPP) published by the Population Division of the United Nations (UN). The 2011 Revision, released in May 2011, is the most recent revision of the WPP.7 This revision projects population from 2011 until 2100, with historical data back to 1950. Projections are based on assumptions regarding future trends in fertility, mortality and international migration. Four fertility scenarios are reported for each country: low; medium; high; and constant. The medium variant (which is also the central case) uses a probabilistic method for projecting total fertility based on empirical fertility trends observed for all countries between 1950 and 2010 (for more information, see United Nations, 2011). Under the low variant, fertility is projected to remain 0.5 children below the medium variant, while under the high variant fertility is projected to remain 0.5 children above the medium variant. Finally, the constant variant assumes a fertility rate equal to that over the period 2005-2010. Our long-term GDP projections rely on the population projections generated using the medium variant assumption. In particular, we construct country specific productivity using UN projections of working age population, defined as male and females aged between 15 and 64.
Source: Authors’ calculations and UN (2011).
The working age population projections for selected groups are shown in Table 1. With the exception of Sub-Saharan Africa, which is expected to growth strongly over the next 40 years, regional populations are expected to decline or at least plateau over the projection period. For example, Asia’s working age population is expected to peak around 2030 at 2.8 billion and then decline to 2.7 billion by 2050.
Labour productivity
Historic estimates of labour productivity, defined as GDP per worker, are calculated using the historic real GDP levels derived from the IMF, TED and Maddison databases and the UN’s historic working age population data. Table 2 shows that the 2012 level of productivity of the advanced group is roughly three times as large as that of combined Asia and ten times as large as that of combined Sub-Saharan Africa.
Source: Authors’ calculations.
4 See Appendix A for further details of data sources.
5 For further details see The Conference Board Total Economy Database™ Methodological Notes.
6 Appendix B provides a breakdown of economies included in the various defined groupings. Details of IMF region/group definitions can be found on the IMF WEO website.
7 The UN issues a new revision every two years and the next revision is due in the first half of 2013.