Downloads
- Bateman Lecture - Slide pack [PPTX 556KB]
Acknowledgments
Thank you for that introduction, Mark.
I'd like to start by acknowledging the traditional owners of the land on which we meet today, the Whadjuk people, and pay my respects to their Elders both past and present.
I'd also like to acknowledge Professor Stephen Smith, Chair of the Advisory Board for the UWA Public Policy Institute, and the UWA Public Policy Institute for hosting today's event. I would also like to acknowledge the Dean of the UWA Business School, Professor Peter Robertson, Mr Shane Love MLA, and Mr Amit Kumar Mishra, Consul General of India in Perth.
The Bateman Lecture has an impressive record of attracting prominent economic thought leaders to the University of Western Australia. And it is an honour to deliver today's lecture.
I'd like to acknowledge the Bateman family, who established this lecture in 1966 in memory of Mervyn John Bateman. Mervyn was the Managing Director of M.J. Bateman, with his ancestor, John Bateman arriving in Western Australia in 1830 to settle on an acre of land in Fremantle. The Batemans supported coastal trade with the pastoralists in Western Australia's North West and Kimberley regions, and are credited with introducing Australian Rules football to Western Australia.
Introduction
I am delighted to be giving my first public address as Treasury Secretary here in Western Australia.
Treasury is the Australian Government's leading economic policy adviser. But as public officials we have no monopoly on providing advice to government and competing views fly around thick and fast. My predecessor – John Fraser – to whom this invitation to speak was originally made, increased Treasury's outreach and accessibility through State offices as one way to better understand those views, and I intend to continue that. I want Treasury to have a close working relationship with the UWA Public Policy Institute and others in Australia who share an interest in collaborating to inform public policy.
I will start today by covering global and domestic economic conditions.
Second, I will discuss contributions to Australia's growth, identifying some of the economic reforms and policies I was associated with earlier in my career that have contributed to our uninterrupted economic growth over the past twenty seven years.
Third, I will draw on the Productivity Commission's recent work on inequality to provide evidence that Australia's long period of economic growth has been shared across the community.
Finally, I will discuss some of the unique characteristics of the Western Australian economy, and briefly raise a couple of things that we in Treasury are learning from our presence in Perth.
Global and domestic economic conditions
The Australian economy has now entered its 27th consecutive year of economic growth. That rolls off the tongue pretty easily but think about it for a moment - no other developed country is currently experiencing a comparable run of growth. We should also be proud "…that it has delivered for the average Australian household in every income decile significantly improved living standards."1 I will expand on this finding and others by the Productivity Commission later.
Over the past decade Australia has also performed well in comparison to the G7. The economy continues to evolve largely as was expected in the 2018-19 Budget handed down in May. Growth in the most recent quarters was driven by household consumption, business investment and new public final demand.

The unemployment rate has fallen to 5.3 per cent, business conditions and confidence remain above long-run averages and the expansion in mining capacity is supporting growth in exports.
Our outlook, as outlined in the Budget, is for the economy to continue to strengthen, unemployment to continue to decline and inflation to gradually increase over the next couple of years. This view is shared by the RBA in their most recent Statement on Monetary Policy in August. I note the Reserve Bank board is here in Perth this week and for clarity stress that my remarks in this speech are made as Treasury Secretary and do not reflect the views of the Bank.
We will get a further read on the economy tomorrow when the June quarter National Accounts are released.
Global economic conditions
Australia is the world's 19th largest economy, with the fifth most traded currency. Last year the strength of the global economy took many by surprise - we saw widespread growth across both advanced and emerging countries. This helped to support the Australian economy as well.
Global GDP growth remains relatively strong despite most major advanced economies recording subdued results in the March quarter. While there is some evidence that these results were driven by temporary factors, the June quarter results released to date have been mixed suggesting growth may be becoming less synchronised.
Growth has strengthened in some economies. In the United States, a significant fiscal stimulus has boosted growth in 2018 and strong growth is forecast in the near term. In India, a recovery from disruption in 2017 continues.2 In line with expectations, the Chinese economy has moderated in 2018, due in part to an increased emphasis by authorities on higher quality growth. Euro area growth also moderated off the high levels recorded in 2017, while in Japan, the start to the year was more mixed, with a contraction in the first quarter followed by a rebound in the second.
Trade policy uncertainty
Global trade policy uncertainty remains high and the situation continues to evolve. To date tariffs arising from the trade tensions only cover around 1 per cent of world trade. The effects of trade measures continue to be limited to specific markets and have not yet had any major discernible macroeconomic impacts. Risks of escalation remain and could negatively affect global growth if the current threats are realised and confidence is affected.
The United States, China and others have raised tariffs on a number of products, including steel. Although there may be more trade actions to come, so far, Australia's exports have not been targeted.
Strong relationships with allies are helpful in this respect, but so too are good trading relationships and free trade agreements founded on a rules-based system which provide better access for Australian goods and services to the supply chains that serve a global market of almost three billion people compared to our 25 million. As a middle-ranking, trade exposed, capital importing nation it is not only the global economy that matters to our domestic economy but also the rules of engagement. We will continue strong advocacy for the multilateral trading system and will continue to pursue new trade opportunities, as the weekend's agreement with Indonesia shows.
Other risks
As outlined in the Budget, Australia is exposed to other global risks such as the prospect of a faster-than-expected tightening in monetary policy and geopolitical tensions. More broadly, a very sharp adjustment in financial markets, which might occur from a range of factors including elevated debt levels in a number of economies, would pose a risk to both global and domestic activity.
There are also risks closer to home. Drought is a challenging fact of life for Australian farmers and poses risks to the agricultural outlook. Some regions of the country are in particular pain. There have been dry seasonal conditions across south-eastern Australia, with well-below-average rainfall and deteriorating soil moisture levels.
While parts of southern New South Wales, Victoria, South Australia, Queensland and Western Australia have received close to average rainfall in recent months, much of New South Wales and Queensland continue to experience rainfall deficiencies and farmers and their communities are facing increasingly challenging conditions.
Recent liaison discussions with our Perth office tell us agricultural areas in Western Australia have been experiencing more favourable weather conditions, suggesting that the agricultural outlook for the State may offset some of the poorer conditions we have seen on the east coast. We understand the WA grain belt could even be on track for a bumper winter crop in the 2018 season after a record-setting 2016. Timely and sufficient rainfall remains important to the agriculture outlook and Western Australia in particular is hoping for a mild spring to boost production.
Future headwinds
Our 27 years of uninterrupted economic growth is an impressive outcome but we must not be complacent.

Over recent decades, Australia's economic performance has been supported by a growing population as well as increasing labour force participation and periods of high productivity growth. All have contributed to growth in incomes and high living standards. The last three bars in this chart show that the terms of trade provided considerable support to the whole economy for a number of years, but when the terms of trade returned closer to long-run levels, it detracted from income growth. 3
It means we can't rely on the terms of trade as a source of ongoing income growth.
Population ageing is also likely to place downward pressure on labour force participation.4
In the medium term, income growth will therefore largely be determined by our success in raising productivity, either through capital deepening or by improving multi factor productivity.
Contributions to continuous growth
Productivity growth will remain essential to sustaining future gains in living standards. At the risk of accusations of being nostalgic, I would like to mention just a few of Australia's previous productivity enhancing reforms that I was fortunate to be working on through my career.
These reforms were largely aimed at raising the efficiency of the microeconomy and followed a set of largely reactive reforms that started in the 1970s which were necessary to protect and improve Australia's macroeconomic stability.
In the 1980s a series of structural reforms commenced to address supply side inefficiencies, allow better use of markets to determine output and prices, design regulation around public interest and increase the recognition of consumer preferences.
- In 1984 I worked on the National Road Freight Industry Inquiry. It found that, generally, the road freight industry was more competitive than much of Australian industry. It established on economic efficiency grounds there was a very strong case for the introduction of vehicle-kilometre charges – more than 30 years later this is still under consideration by governments. But as a result of the Inquiry, efficiency-sapping state registration fees and weight limit regulations were busted and registration fees were more closely related to road damage impacts. Innovation resulted and heavier vehicles like B-doubles came about to make Australia's road transport industry one of the safest and best that has also expanded and effectively competes overseas.
- Also in the 1980s I worked on the dismantling of the Commonwealth's two airlines policy under which the government tightly controlled the industry through approval of aircraft imports, timetables and regulated airfares. The policy came to an end in 1990 after thirty odd years in existence.
- The Bureau of Transport and Communications Economics (BTCE)'s analysis of deregulation of the airline industry showed:
- From a consumer's perspective, deregulation was very successful and consumer benefits included more readily available discount fares, increased flight frequency and non-stop service, improved on-time performance and in-cabin and on ground services.
- From a carrier's perspective, production efficiency improved, with lower costs of providing service. It also found greater price competition, a large increase in overall capacity and decrease in high yield business traffic due to the recession had an adverse impact on the airlines' profitability.
- In the early 1990s I was involved in Commonwealth government business enterprise reforms that injected a greater commercial focus into government owned entities in the aviation, shipping, rail and telecommunications entities like ANL, Telecom, OTC and ANR. The states were doing the same in utility businesses.
- While at the Department of Prime Minister and Cabinet I was also involved with the establishment of the National Electricity Market as the interconnected east coast network is called.
- The 1993 report of the Hilmer Review brought together, under the framework of developing a national competition policy, recommendations to extend the reach of competition law to government businesses and to ensure that government regulation only restricted competition where it clearly served the public interest.
- The review incorporated the work already proceeding to make government businesses more commercially focused and to expose them to competitive pressure.
- In 2005, the Productivity Commission estimated that the 1995 Hilmer reforms increased Australia's GDP by 2.5 per cent. The Commission also identified significant falls in, for example, rail freight rates, port charges, telecommunications charges, milk prices and even, until 2005 at least, electricity prices, although it also acknowledged that some sectors did not fare so well. For example, dairy deregulation significantly reduced returns for those dairy farmers who were heavily dependent on previously protected markets.
- In 1995 and 1996 I continued work on government business enterprises and the electricity market during my time in a senior role in the South Australian Treasury and Finance Department.
- While Chief of Staff for Treasurer Peter Costello, I was part of the cast and worked closely with Treasury on many reforms including:
- Implementing the 1998 Charter of Budget Honesty to improve fiscal outcomes by requiring a fiscal strategy and greater public scrutiny of fiscal performance.
- Implementing the 1996 Wallis Inquiry recommendations which recognised that all markets face potential problems of misconduct, anti-competitive behaviour and incomplete information and that retail consumers often had insufficient knowledge to navigate increasingly complex financial products. Higher disclosure requirements were implemented.
- The Inquiry also established Australia's twin peaks model of two independent regulators - APRA, a prudential regulator and ASIC, a market conduct and disclosure regulator. Over time, other countries adopted this model and the Financial Systems Inquiry report re-affirmed the model. I note that financial sector conduct is currently the subject of a Royal Commission.
- Developing and implementing the comprehensive reforms set out in Australia's New Tax System (ANTS) which replaced wholesale sales taxes with the GST, abolished some state taxes, reduced personal income taxes and simplified and reformed the welfare system. This was a multi-year effort starting in 1998 and coming into effect in 2001.
- Overall the package improved incentives, with greater reward for effort, and boosted business activity and investment by improving the indirect tax regime.
- And I worked on the establishment of Australia's Future Fund and its first investment mandate.
In the interests of time I will not go into the detail of my time establishing the Policy Support Unit in APEC in Singapore in 2008-2010 nor my time as NSW Treasury Secretary between 2011 and 2015.
I returned to Canberra with no pre-determined job in 2015 after commuting to Sydney for four years. Before re-entering the Canberra bureacrcay the new Treasurer Scott Morrison asked that I head his office.
I will refer to one outcome of many during my time with Treasurer Morrison that gave me great pleasure. It was being able to convince him, along with Treasury advice, to get the Productivity Commission to conduct a five yearly Productivity review of the Australian economy. I say that because I spoke with Peter Harris about doing such a report when I was NSW Treasury Secretary and the first - Shifting the Dial -was a great one that focussed on the non-market sector and the importance of effective government service provision. As then Treasurer Scott Morrison observed, there are few low hanging fruit left in microeconomic reform, but Shifting the Dial provides a roadmap for reform of the important non-market sectors.
Sharing growth across the community
That is a good segue to a more recent Productivity Commission report I briefly referred to earlier - a comprehensive research paper measuring how economic capacity is shared across the Australian community.
Populist views about inequality have been a common theme of recent economic analysis and commentary both here and overseas.
The Rising Inequality? A stocktake of the evidenceresearch report by the Productivity Commission uses data and facts to show that resources and opportunity are well distributed across the community and the benefits of a long period of economic growth in Australia have been shared across the community.

In its usual clinical way, the Commission collects, dissects and analyses the latest and most complete evidence to examine inequality, poverty and disadvantage in Australia. In my time available today I will focus on income inequality but the entire report is a compelling read. Let me take you through four charts:
The first chart tracks Australia's Gini co-efficient for income and consumption. The Gini measure is an internationally comparable way of looking at inequality, expressed as a number between 0 and 1, where a result closer to 1 indicates incomes are more unequal between rich and poor. But the Productivity Commission looks at not only private income, it also includes the impact of taxes and transfers and the provision by Government of in-kind transfers such as health, education and childcare, as the consumption of these services directly contribute to the well-being of households and individuals.
Measuring on a disposable income basis, inequality in Australia is close to the OECD average. It rose slightly over the thirty year period, but not as fast as others in the OECD, and has decreased since the Global Financial Crisis.
Australia's progressive income tax and targeted transfer system plays a significant role in reducing Australia's inequality - the Gini measure for disposable income is around 30 per cent lower than private income.
Further adding Australia's in-kind transfers to recognise consumption of services lowers the measure again in the order of 25 per cent. The consumption lines reflect that low income earners receive the largest amount of in-kind transfers.
Note also that the private and final consumption lines are smoother over time than the income lines – this is because consumption recognises the impact borrowing and saving can have on consumption and access to economic resources.

This second chart shows average income growth per annum by income decile from 1988-89 to 2015-16 – in real dollar terms on the left and in percentage terms on the right. These data show that income growth has been shared across all income deciles. Gini coefficients respond to the percentage growth panel on the right hand side. No matter how the data are dissected, the gains from income growth in Australia are shared relatively evenly.
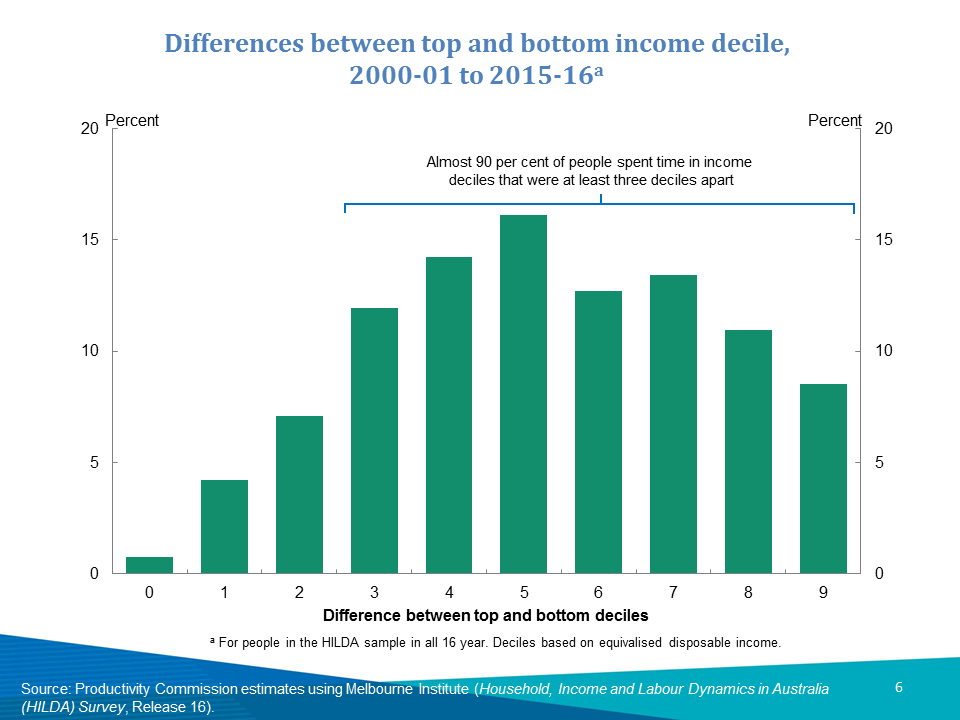
Third, income mobility is high in Australia. It is common sense that people's incomes change through their lives and as a result Australians move both up and down the income distribution. People at the bottom tend to move up, and people at the top tend to move down. The chart shows the difference between Australians' top and bottom income deciles in the sixteen years to 2015-16 – the difference on the horizontal axis, the percentage of Australians on the vertical – the further right the greater the difference between a person's top and bottom income decile. The Commission found that fewer than one in a hundred Australians stayed in the same income decile over the sixteen years and almost 90 per cent of Australians moved three income deciles or more. The number of people with significant mobility is high - compared with the United States the Commission finds Australia's mobility is higher and the top and bottom are less 'sticky'. Over a third of the population was in the top income decile for at least one year, and 40 per cent spent time in the bottom decile, illustrating that for most, periods of low income are only temporary. While less pronounced, the Commission also found substantial wealth mobility as opposed to income mobility, with more than 40 per cent moving three deciles or more.

Finally, the Commission also provides a temporal perspective that recognizes the weaknesses of Gini measures which only record a point in time result. The Commission addresses this weakness by taking into account life course income mobility to recognise the changes in an individual's economic position through their life. Using average income over sixteen years rather than annual income, the Commission finds that Australia's Gini coefficient for income is 18 per cent lower.5 By using consumption over the last ten years the Gini coefficient is 12 per cent lower.
Let me summarise these four findings of the Productivity Commission in relation to inequality in Australia:
- Our tax and Government transfer systems serve to significantly reduce inequality of access to economic resources;
- Income growth has been shared broadly in Australia;
- Income and wealth mobility are high; and
- Inequality is substantially lowered when taking into account incomes over time compared to point-in-time estimates.
However, a small group of Australians remain in persistent economic disadvantage – including people with disabilities, single-parent families, unemployed people and many Indigenous Australians. These Australians face a complex set of challenges that limit their potential to seize economic opportunities or develop skills. It is important to continue to search for innovative policy approaches to ensure that all people can share in the growth and opportunity that has benefited the overwhelming majority of Australians.
The Western Australian economy
Having talked about our international and Australian economies, I want to now focus on Western Australia.
The contribution of Western Australia
Western Australia is a key contributor to the Australian economy through its significant national and global mining footprint.
Western Australia accounts for around 15 per cent of the Australian economy and around 10 per cent of both population and national employment.

Australia has recorded 16 trade surpluses over the 20 months to June, mostly driven by resource exports.
Western Australia produces and exports most of Australia's iron ore and LNG – which is significant on a global scale as Australia is the world's largest exporter of iron ore and is set to become the world's largest exporter of LNG.
Australia's once-in-a-hundred-year mining investment boom drove significant expansion in Australia's mining export capacity, which has now almost doubled since the start of the mining boom. Western Australia has accounted for around half of this investment, with the significant expansion in Australia's iron ore and LNG industries. Since the start of the mining boom, iron ore export volumes have more than tripled and LNG exports have increased by more than five times.
In 2017, Western Australia was Australia's largest exporter of merchandise goods accounting for around 40 per cent of all Australian merchandise exports. Western Australia exports around half of its export goods to China.
Outlook for Western Australia
Western Australia continues to experience the impact of shifts away from mining investment and towards resource exports, although the drag from falling mining investment appears to be almost complete.
Business and consumer confidence in Western Australia have both lifted from the very low levels seen in 2015.
Optimism is translating into a pick up in the mining sector. Recent feedback from leaders in Western Australia's mining construction and contracting industries revealed signs of increasing economic activity and confidence. At Treasury's recent regional engagement in the Pilbara we heard and saw evidence of increasing confidence and mining investment. Participants reported skill shortages in some technical mining roles, and wage and contract pricing pressures.
Non-mining investment has been subdued in recent years, as the scaling back of mining investment projects continues to have flow on effects to the broader State economy. However, the latest ABS Capex Survey suggests some signs of a pickup in non-mining investment.
As METRONET and other transport infrastructure projects ramp up we expect public engineering construction to contribute to the Western Australian economy.
Mining and technology
In addition to providing valuable investment, exports and employment, the Western Australian mining sector is a great example of an early adopter of technology reaping the benefits of increased efficiency, enhanced safety and workforce diversification.
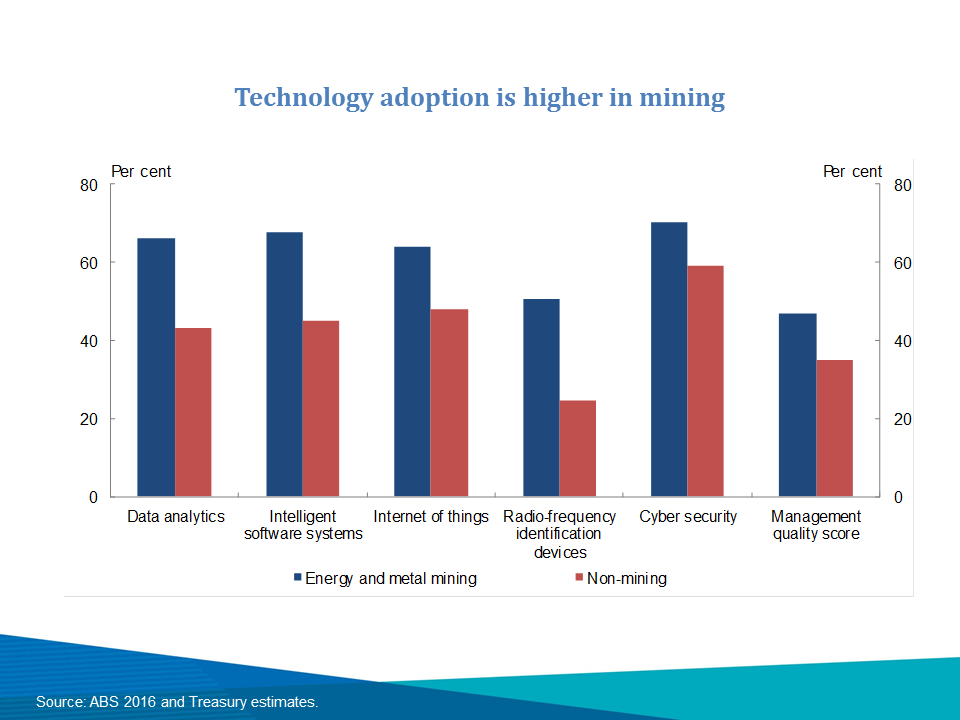
We have seen examples of this across Western Australia's resources industries, and our consultation with industry demonstrates that technology adoption extends far beyond the headlines of driverless vehicles.
Compared to other sectors, Australian mining – led by Western Australia – has adapted more quickly to the use of technologies such as data analytics and enterprise resource planning systems and also managerial practices. If all our sectors moved up to the level of the mining sector we would see a significant boost in our overall living standards. Treasury analysis – based on the estimated relationship between productivity and managerial quality at the firm level – suggest that labour productivity in the non-mining sector could be around 6 per cent higher in the long run. This is broadly consistent with international studies that demonstrate a causal impact of managerial practices on productivity and implies a significant boost to overall living standards.
Western Australia and GST
Western Australia understandably looks north and west for opportunity. Looking east, the GST and how it is distributed seems to knock louder.
I'm very familiar with issues around the GST as I was head of the Secretariat of the 2011 review of GST distribution with Nick Greiner, John Brumby and Bruce Carter. In the lead up to that review, Western Australia's GST relativity was around 0.7. It then fell to a low of 0.3 in 2015-166 as a result of unprecedented increase in its mining royalties — $2.3 billion in 2009-10 to a peak of $6 billion in 2013-14.
The Commonwealth has a proposal currently with the states to change the benchmark and set an in-system relativity floor to prevent any future outliers in the equalisation process.
I do not intend today to go into details, but I am sure I will when I next meet with State Heads of Treasuries and the Commonwealth Treasurer meets his State and Territory counterparts to reach a lasting solution.
Conclusion
We get the sense that the community and media focus on negatives when reporting on the economy - the glass is too often reported as half empty.
As I described, the global economy is strong but not without risks. Our domestic economy is faring well through its 27th consecutive year of economic growth.
Evidence shows that the benefits of economic growth and prosperity are shared right across the community through policy settings, especially through our targeted tax and transfer system.

Critical to delivering income growth and to sustain future gains in living standards given demographic headwinds will be a focus on productivity. This final chart shows the average contribution to income growth from productivity gains in dark green, and in light green the additional gain in labour productivity that is needed to maintain income growth consistent with the average rate over the past 30 years. This will be the strongest form of insurance to mitigate the expected headwinds of labour utilisation and terms of trade normalisation.
I would like to finish by again thanking the UWA Public Policy Institute for inviting me here today. I welcome your mandate to act as a 'bridge between academic research and government, public and business needs, delivering real-world policy impact.'7
I am pleased that the bridge doesn't have to extend far to reach Treasury with our office just down the road on St Georges Terrace.
Thank you, I appreciate the opportunity to speak to you today.
1 - Rising Inequality? A stocktake of evidence, Productivity Commission Research Paper, 2018, p2
2 - The disruption refers to demonetisation when the Indian Government removed all 500 and 1000 Rupee notes from circulation overnight with the aim of combatting corruption, counterfeit currency circulation and terror financing
3 - Most recently, the terms of trade has increased and in the March quarter of 2018 it was 27 per cent above its 30-year average.
4 - Most recently, labour force participation has lifted and is currently 0.7 percentage points above its 2016-17 level.
5 - Using HILDA data, the PC estimates that averaging income over 16 years reduces the Gini coefficient for Australia by 18 per cent from a single year estimate. The chart uses OECD data and finds averaging income over nine years reduces the Gini coefficient for Australia by 14 per cent.
6 - Western Australia relativity for 2018-19 is 0.47 — a significant increase from 2017-18.
7 - https://www.uwa.edu.au/institutes/public-policy/Home