Downloads
Introduction
The re-emergence of China and India into the global economy is the most important global economic development likely to have an impact on the industrial structure, and hence the demand for skills, in the Australian economy over the next 15 years or so. Together accounting for slightly more than one-third of the people on the planet, China and India are growing rapidly and should continue to do so, which will continue to raise demand for mineral and energy commodities of which Australia has abundant supply.
The implications for Australia over the coming 15 years will depend on how rapidly the global supply of commodities rises to meet rising global demand, and on whether any economic or political events conspire to interrupt (or derail?) the rapid economic growth that China and India have enjoyed for the past couple of decades.
Re-Emergence of China and India
The most striking manifestation of China's and India's rapid growth on the Australian economy is the behaviour of the terms of trade over the past several years. Australia is currently experiencing the largest sustained boost to the terms of trade in our history (at least it is if forecasts for the terms of trade over the next couple of years are roughly correct). As far as the data allow us to make such comparisons, the current five-year centred moving average of the terms of trade is much higher than it has been at any time in the past 140 years (Chart 1).
Chart 1: Terms of Trade
(Index 1900-01 to 1999-00 = 100)
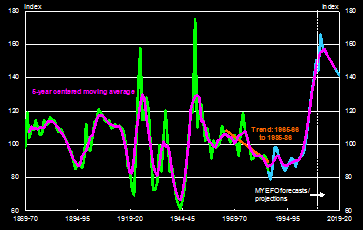
Source: ABS Catalogue Number 5206.0, RBA and Treasury
This high level of the terms of trade is having a profound impact on the Australian real exchange rate, which is at its highest level, and currently about 35 per cent above its average over the 27 years since the Australian dollar was floated in December 1983 (Chart 2). This in turn is having a profound impact on the structure of the traded sector of the Australian economy. In particular, those parts of the traded sector not linked in some way to the boom in the production of mining and energy commodities are facing severe and sustained competitive pressure from foreign competitors.
Chart 2: Australian Real Exchange Rate
(Post-float average = 100)
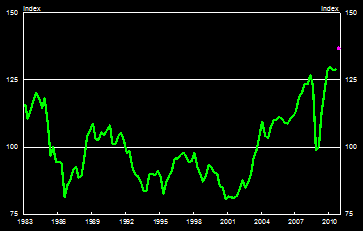
Source: Reserve Bank of Australia and Treasury.
An issue of central relevance to this forum is the likelihood that high levels of the terms of trade, and hence the real exchange rate, will be sustained for much of the next fifteen years.
On this point, it is worth noting that the high terms of trade is being driven predominantly by rapid economic growth in Asia, and particularly in the Asian giants, China and India. Even though China and India have been growing rapidly for the past few decades, they remain at the early stages of their economic development. Their standards of living relative to that of the developed world (as proxied by the ratio of their GDP per capita at PPP exchange rates to that of the 15 OECD countries with the highest standards of living) are currently lower than was Japan's standard of living in the early 1950s relative to the developed world's standard of living at that time (Chart 3).
Chart 3: GDP Per Capita
(Percent of OECD -15 average)
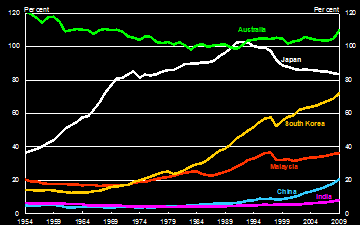
Note: OECD-15 = Australia, Austria, Belgium, Denmark, Finland, France, Iceland, Ireland, Netherlands, Norway, Sweden, Switzerland, UK, US and Canada.
Source: The Conference Board Total Economy Database and Treasury.
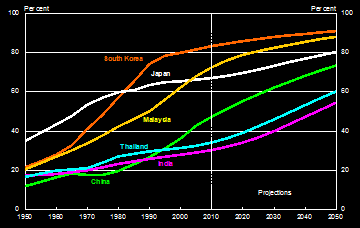
From this level of development relative to the developed world, Japan – followed by a string of other East Asian economies – experienced strong catch-up growth for a few decades as their standard of living climbed closer to that of the developed world. Based on this experience, China and India should continue strong catch-up growth for at least a few more decades – and certainly for the next 15 years. Of course, nothing is for sure, and a range of accidents could intervene to render this prediction wide of the mark.
Along with rapid economic development comes rising urban population shares and, at least at these early stages of economic development, rising per capita consumption of a range of mineral and energy commodities (Charts 4 and 5).
Chart 4: Urban Population Shares
Source: United Nations population database.
Chart 5: Consumption Per Capita
Aluminium (left) and Finished steel (right)
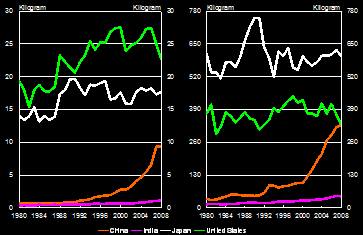
Source: ABARE, Steel Statistics Yearbooks and Treasury.
It therefore seems most likely that there will be strong growth in demand for the mineral and energy commodities (particularly iron ore and coal) that Australia produces for at least the next 15 years.
By itself, strong growth in demand does not guarantee that commodity prices (and therefore Australia's terms of trade) will remain high. The extremely high rates of profitability associated with the production of these commodities are bringing forth very significant global supply responses.
There are a range of possible scenarios here. One possibility, which presumes no serious prolonged adverse developments that derail the catch-up process in China and India, is that average prices for commodities remain relatively high – well above the average cost of production – for an extended period to maintain strong financial incentives for continued rapid exploration and development of new mining capacity (Garnaut, 2006).
An alternative possible scenario is that, in the rush to exploit the current extremely high rates of profitability, so much global supply is brought on stream that commodity prices fall substantially over the next several years – back closer to the marginal cost of production, or even below it for some time.
While these scenarios are both possible, it seems most likely that the terms of trade will be significantly higher on average over the next couple of decades than they were in the couple of decades preceding the current mining boom.
High resource prices, combined with a high Australian real exchange rate, are currently driving factors of production – both labour and capital – out of non-resource parts of the traded sector (including many, but not all, parts of manufacturing) and into mining and construction (Chart 6).1
Chart 6: Australian Employment and Investment
Employment (left) and Investment as a share of GDP (right)
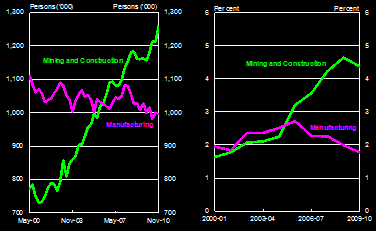
Source: ABS Catalogue Numbers 5206.0, 6204.0, 6291.
0.55.003 and Treasury.
The strongly rising share of employment in the mining and construction sectors is a relatively recent phenomenon, dating from the beginning of the mining boom, around 2003-04. But the associated decline in the share of employment in manufacturing is the continuation of a trend that has been evident for several decades (Chart 7).
Chart 7: Three Speed Economy - Employment Share by Industry
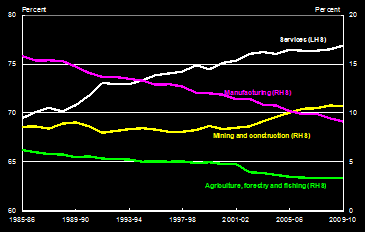
Source: ABS Catalogue Number 6291.0.55.003 and Treasury.
Moreover, for an extended period, the services sectors have accounted for a rising share of employment, and this trend has been affected hardly at all by the mining boom, with the services sectors now accounting for over three-quarters of the employment in the economy.
It is also important to keep in perspective the relative sizes of the sectors of the economy. Although there has been strong employment growth in mining and construction, service sectors (particularly health care and social assistance; professional, scientific and technical services; and education and training) have together accounted for far more of the economy's employment growth since the beginning of the mining boom than have mining and construction (Chart 8).
Chart 8: Employment Change by Industry (2003-04 to 2009-10)
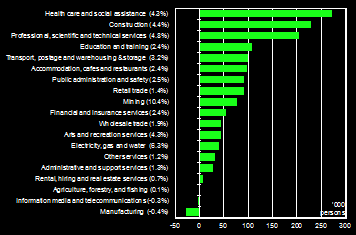
Note: Average annual growth in parentheses.
Source: ABS Catalogue Number 6291.0.55.003.
Even if the terms of trade remain high (which, in turn, may lead to continued strong growth in the mining and construction sectors – though this is clearly not assured), it seems most likely that growth in the number of people employed in the service sectors will continue to outstrip growth in the number employed in mining and construction.
A related development, and one that is likely to be relevant over the next 15 years, is increased direct competition in the non-resource parts of the Australian traded sector from China and India, with flow-on effects to employment in those sectors of the Australian economy. The most obvious parts of the Australian traded sector likely to be subject to this increased direct competition are manufacturing – especially as Chinese and Indian production moves to increasingly sophisticated manufacturing goods (for example, automobiles) as their real wages rise, but also parts of the IT sector, where lower costs, especially in India, provide a continuing incentive to outsource. The high level of the Australian dollar acts to accelerate these trends.
Productivity
In thinking about future prospects, it is as well to keep in mind that productivity growth is particularly hard to forecast. To give two prominent examples, neither the global slowdown in productivity growth in the mid 1970s nor the acceleration in the US in the mid 1990s was predicted.
Given this difficulty, in successive Intergenerational Reports, labour productivity is simply assumed to continue to grow at the same rate that it did over the previous thirty years. The 2002 Intergenerational Report assumed future annual labour productivity growth of 1¾ per cent, the thirty-year average at the time, but by the 2010 Intergenerational Report, the thirty-year average, and hence the assumed future growth rate, had fallen to 1.6 per cent.
Notwithstanding the difficulties, it is still of interest to discuss the factors that will be relevant for labour productivity growth over the next 15 years.
The first of these is the prospects for multifactor productivity growth, which has been very weak over the past several years. Measured multifactor productivity growth in the market sector has been slightly negative over the most recent productivity growth cycle, 2003-04 to 2007-08 (Chart 9). This outcome has been attributed by many to a dearth of major productivity-enhancing reforms over the past decade or so (see, for example, Banks 2010). If this suggestion is correct, it would not augur well for multifactor productivity growth over the next 15 years since there are usually significant lags from significant reform to the ensuing productivity benefits. Even reforms recently underway will take time to have a favourable impact on multifactor productivity growth.
Chart 9: Labour Productivity Growth
(Market Sector)
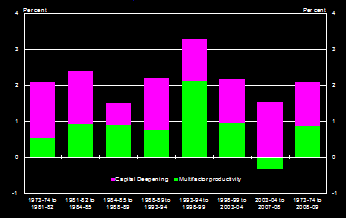
Source ABS Calatogue Number 5206.0 and Treasury.
At the same time as multifactor productivity growth has been weak, extremely strong rates of physical investment have seen the capital-to-labour ratio rise much faster than its earlier trend (Lowe 2010). Using a simple aggregate production function, the 2 percentage point increase in the annual growth rate of the capital stock (excluding dwellings) that we have seen over the past five years or so should lift the annual growth rate of labour productivity by something like ⅔ of one percent (although the duration of this lift in productivity growth depends on the duration of the lift in the growth rate of the capital-to-labour ratio).2
Some other plausible developments in the economy should be expected to have smaller effects on productivity growth – some favourable, others adverse.
Well-designed economy-wide market-based mechanisms for reducing Australia's greenhouse gas emissions are projected to reduce annual labour productivity growth by around 0.1 percent, even for quite deep cuts in emissions (Australian Government, 2008). Of course, were alternative regulatory, or other non-market-based, mechanisms for reducing greenhouse gas emissions implemented, that would be expected to have much more adverse effects on the economy's aggregate labour productivity growth.
Plausible shifts in the industrial structure of the economy driven by the high terms of trade should be expected to have only small effects on the economy's aggregate annual rate of productivity growth. A continued rise in mining's share of aggregate output should raise aggregate labour productivity, but most of this effect is already captured by the higher capital-to-labour ratio in mining.
References
Australian Government, 2008, 'Australia's Low Pollution Future: The Economics of Climate Change Mitigation'.
Banks, Gary, 2010, 'Successful reform: past lessons, future challenges', keynote address to the Australian Business Economists Annual Forecasting Conference on 8 December 2010, Sydney.
Garnaut, Ross 2006, 'The China Resources Boom', paper presented to the Australian Agriculture and Resource Economics Conference, Sydney.
Lowe, Phil, 2010, 'Forecasting in an Uncertain World', address to the Australian Business Economists Annual Forecasting Conference Dinner on 8 December 2010, Sydney.
1 Much of the increase in construction activity and employment are associated with the mining sector, but some is also associated with higher infrastructure spending by State and Federal Governments.
2 For a Cobb-Douglas production function, the rise in labour productivity growth is the product of the rise in the growth rate of the capital-to-labour ratio and the capital share of national income.