The following is a reprint of Statement 2, Economic Outlook, from Budget Paper No. 1: Budget Strategy and Outlook 2000-01.
Statement 2: Economic Outlook
Part I: Overview
The Australian economy has grown by more than 4 per cent in each of the last three years. In 2000-01, it is expected to grow by a solid 3 per cent. Employment growth is likely to remain robust, with unemployment falling to decade lows and the outlook for ongoing inflation remaining favourable.
This positive outlook for solid growth in a low inflation environment continues to be underpinned by the structural improvement in productivity performance evident during the current economic expansion.
A significant rebalancing of the components of growth is expected in 2000-01. Domestic demand is expected to grow at a more moderate pace than in recent years. This reflects moderating consumption growth as wealth effects from house price and share price movements stabilise as well as an unwinding of a net bring-forward of expenditure ahead of The New Tax System, and some effects of recent increases in interest rates. Partly offsetting the slowing in these elements of domestic demand will be stronger growth in business investment, and a significant strengthening in net exports. The strong net exports contribution to growth in 2000-01 reflects faster world economic growth and some moderation in domestic demand, along with a boost to services exports from the Olympics. The overall decline in the Australian exchange rate during the course of 1999-2000 will also contribute to a stronger net export performance in 2000-01.
The combination of strong economic growth, coupled with moderate wage outcomes and strong productivity growth, has supported employment growth and allowed the unemployment rate to decline to around the lowest levels in a decade. Employment growth is forecast to remain robust in 2000-01, at 2 per cent, following growth of around 2 per cent in 1999-2000. The unemployment rate is expected to fall further, to 6 per cent by the June quarter 2001. If the current macroeconomic policy framework is maintained together with ongoing structural reform, unemployment could fall further thereafter to levels not reached in a quarter of a century.
Inflation is expected to be around 2 per cent in year-average terms in 1999-2000. The slight increase from the very low outcomes of previous years mainly reflects the impact of higher world oil prices over calendar 1999 and in the early months of this year. In 2000-01, ongoing inflation (that is, leaving aside the impact on prices of changes in indirect taxes) is forecast to be around 2 per cent through the year to the June quarter 2001. This means that the major changes to indirect tax arrangements under The New Tax System will be occurring at a time when the outlook for ongoing inflation remains favourable and wage pressures continue to be moderate.
The effect of indirect tax reform on prices will not be felt evenly through 2000-01, with the main effect occurring in the September quarter 2000. In that quarter, the impact of the Goods and Services Tax (GST) on retail prices will be only partly offset by the removal of Wholesale Sales Tax (WST) on final consumption items. While estimating quarterly outcomes is inherently difficult, the overall increase in the CPI in the September quarter could be of the order of 4 per cent, of which a little over 3 per cent would be the result of one-off price changes associated with indirect tax reform.
In subsequent quarters, increases in the CPI will be smaller than would otherwise have been the case, as the removal of WST and the reduction in the cost of fuel to business reduce embedded production and transportation costs and hence put downward pressure on retail prices. As a result, and as noted in the 1999-2000 Mid-Year Economic and Fiscal Outlook (MYEFO), The New Tax System is expected to add around 2 percentage points to the CPI through the year to the June quarter 2001, less than the projected increase for the September quarter. Taking together the estimate of ongoing inflation and the impact of The New Tax System on prices, the CPI is forecast to rise by around 5 per cent through the year to the June quarter 2001. Households will be more than compensated for the one-off price impact of indirect tax reform via income tax cuts and increases in welfare payments. The changes to indirect tax arrangements are therefore not expected to have any significant impact on wage settlements or ongoing inflationary pressure. These issues are discussed in more detail in Statement 3.
The New Tax System will provide substantial income tax cuts and increases in social security payments in 2000-01, with the impact on real household disposable income, and hence household consumption, only partly offset by overall increases in indirect taxes. However, it is likely that households are bringing forward some consumption expenditure into the latter part of 1999-2000, ahead of the changes to indirect tax arrangements. This means that this component of demand will be lower than otherwise in the early part of 2000-01.
A similar pattern is occurring in residential construction, with strong activity in this sector in 1999-2000 ahead of the introduction of The New Tax System. As a result a moderate easing in residential construction is expected in 2000-01.
Growth in public final demand in 2000-01 is also expected to be below the growth rates recorded in recent years, reflecting moderate growth in public consumption and much slower growth in public investment expenditure after two years of strong growth.
One component of domestic demand expected to grow more quickly in 2000-01 than in recent years is business investment, which will be supported by a stronger world economy and the beneficial impact of The New Tax System on the price of investment goods and business costs.
The current account deficit (CAD) is forecast to average 4 per cent of GDP in 2000-01, down from 5 per cent of GDP in 1999-2000. Without the one-off boost to exports from the Olympics, the CAD would be expected to be closer to 5 per cent of GDP in 2000-01. The expected decline in the CAD reflects the impact on net export volumes and the terms of trade of the stronger world economy, along with some moderation in the rate of growth of domestic demand.
Table 1: Domestic Economy Forecasts(a)
(a) Percentage change on preceding year unless otherwise indicated.
(b) Calculated using original data.
(c) Chain volume measure.
(d) Percentage point contribution to growth in GDP.
(e) Calculated at basic prices.
(f) Transfers are net second-hand asset sales from the public sector to the private sector. One-off transactions are gold sales by the Reserve Bank and the export of an ANZAC frigate.
(g) Average non-farm compensation of employees (national accounts basis).
(h) The estimate in the final column represents the forecast level in the June quarter 2001.
Part II: The Outlook for the International Economy
After a solid pick-up in 1999, world economic growth is expected to increase further in 2000 and 2001 to rates above the long-term average.
Supported by continuing strong economic growth in the United States (US) and a rebound in activity in non-Japan East Asia, which was larger and sooner than expected, the world economy grew by 3.3 per c
ent in 1999, after growth of 2.5 per cent in 1998. World growth is expected to strengthen further in 2000 to 4 per cent, with another year of strong growth in the US, improvement in Japan and Europe and continued solid growth in non-Japan East Asia. For 2001, while growth is expected to slow in the US, the momentum in other major economies is expected to continue. Overall, world growth is projected to moderate slightly to 3 per cent in 2001 — towards longer-term trend growth.
Chart 1: World GDP Growth Rates(a)
(a) World GDP growth rates are calculated using GDP weights based on purchasing power parity.
Source: Various national statistical publications, International Monetary Fund (IMF) and Treasury.
World inflation is expected to remain benign, despite the improving outlook for world economic activity. While the sharp increase in oil prices had raised some concerns about the outlook for inflation in the world economy, these concerns have dissipated somewhat following the late March agreement by the Organisation of Petroleum Exporting Countries to increase production of oil.
Table 2: GDP Growth Rates for Selected Countries and Groupings(a)
(a) Growth rates for World, Total Organisation for Economic Co-operation and Development (OECD), European Union (EU), and non-Japan East Asia are calculated using GDP weights based on purchasing power parity.
(b) Treasury estimates for World, total OECD, and European Union growth rates.
(c) Total OECD comprises the United States, Japan, Germany, France, Italy, the United Kingdom, Canada, Australia, Austria, Belgium, the Czech Republic, Denmark, Finland, Greece, Hungary, Iceland, Ireland, Korea, Luxembourg, Mexico, the Netherlands, New Zealand, Norway, Poland, Portugal, Spain, Sweden, Switzerland, and Turkey.
(d) Non-Japan East Asia consists of Korea, Singapore, Taiwan, Hong Kong, China, Indonesia, Malaysia, Thailand, and the Philippines.
Source: Various national statistical publications, IMF and Treasury.
In 1999, the United States maintained the strong momentum of recent years, with growth accelerating over the second half of the year. This continued strength has seen the US achieve its longest economic expansion on record. As a result, the unemployment rate has fallen to around 4 per cent, the lowest level since the early 1970s.
Robust employment and wages growth have supported incomes, while historically high levels of consumer confidence and stock market wealth effects have further fuelled growth in private consumption expenditure in excess of income growth. Growth in investment has also remained strong in response to the strength in domestic and external demand.
An important factor supporting the duration and strength of the US expansion, with relatively subdued inflation, has been the positive supply-side influence from high productivity growth. It appears likely that this improvement is not purely a cyclical phenomenon, and that potential growth in the US has risen above 3 per cent.
The outlook for 2000 is for growth to average around 4 per cent, although slowing somewhat in late 2000 and moderating further in 2001 with growth in that year projected to average around 3 per cent. A moderate slowing in consumption growth is anticipated, driven in part by slowing but still robust growth in employment and real disposable income. Strong, albeit moderating, domestic demand, coupled with further growth in export demand, should see high levels of business investment continue.
While inflation is not expected to increase significantly, it represents a risk to the outlook if a stronger monetary policy response is required to promote a more sustainable level of growth. There are also downside risks arising from uncertainties about the movements in asset prices and the effects of sustained falls in these on consumption and investment. On the upside, improvements in productivity could see strong growth in the US continue.
Japan is expected to grow a little more quickly in 2000, after recovering from a contraction of 2.5 per cent in 1998 to grow by 0.3 per cent in 1999. Growth in Japan is expected to be underpinned by supportive fiscal policy, complemented by a gradual pick-up in private capital spending over 2000 and 2001. By contrast, private consumption expenditure is expected to remain weak until employment and household incomes start to grow sustainably. Uncertainties about Japan’s future pension incomes and medical care costs are also expected to continue to dampen consumption. In the light of the strong yen since late 1998, export growth is expected to continue to be balanced by strong import growth, resulting in a negligible net contribution to growth from the external sector. Overall, growth is expected to increase to 1 per cent in 2000 and 1 per cent in 2001.
The scope for ongoing fiscal stimulus is limited. Further progress on various structural reforms, especially in the financial and corporate sectors, is needed for Japan to achieve a more broadly-based and sustained economic recovery in the medium term.
Growth in the European Union (EU) strengthened over the latter half of 1999, following slower growth earlier in the year, in part due to weakness in domestic demand in some of the larger economies and also weaker export demand reflecting the financial and economic instability in emerging market economies. Improved domestic demand growth provided the early stimulus, with a steady increase in external demand broadening the recovery. Growth in the EU is expected to increase to 3 per cent in 2000, moderating to 3 per cent in 2001, with support likely to come from improved business sentiment and industrial production, along with falling unemployment and a competitive euro. The improved world outlook will also underpin export growth in the region.
Growth in the three major euro economies is expected to converge somewhat in 2000 and 2001, as growth in Germany and Italy improves from the relative sluggishness of 1999 and the strong growth in France moderates slightly. The recent high level of activity in the United Kingdom is expected to ease.
While the outlook for the European Union is positive and core inflation (which excludes energy prices) has been low for a considerable time, the main risk to the region could be a sharp rise in wage and price pressures, as growth gathers strength in the larger economies, leading to a stronger than expected monetary policy response. To sustain higher rates of non-inflationary growth and reduce unemployment in the region, greater flexibility in labour and product markets is needed.
Growth in non-Japan East Asia rebounded strongly in 1999, after recording only modest growth of 1.6 per cent in 1998. The turnaround in 1999 occurred in all of the crisis-affected economies, and in some cases — notably Korea, Malaysia and Thailand — the turnaround was sharp (albeit from low bases). Even Indonesia, which suffered the deepest recession, returned to modest positive growth in 1999. Strong external demand, especially from the US, and supportive macroeconomic policies across the region have assisted in the turnaround in growth.
Chart 2: Economic Growth in Selected Major Trading Partners (MTP)
(a) Other East Asian MTP comprises Korea, Singapore, Taiwan,
Hong Kong, Indonesia, Malaysia, Thailand, and the Philippines. GDP weights are based on purchasing power parity.
Source: Various national statistical publications, IMF and Treasury.
For 2000 and 2001, improving consumer and business confidence is expected to broaden the base of the recovery to include an increased contribution from domestic demand. Strong external demand (on the back of growth in the world economy and in the Asian region itself) is expected to continue. It is also expected that fiscal policies will remain supportive of growth. Overall, the region is expected to grow by 6 per cent in 2000 and 6 per cent in 2001.
Longer-term prospects in Asia depend on the timely and effective implementation of further fundamental reforms, especially in the areas of financial and corporate restructuring, the soundness of the legal and governance systems and the transparency of domestic policies.
Prospects for emerging market economies have improved considerably, following the difficulties experienced in 1999. Solid recoveries are expected, particularly across most of Latin America and Russia, but vulnerabilities remain. Domestic demand is expected to continue to gather strength, and the external stimulus provided by stronger world growth, competitive exchange rates, and the rise in commodity prices (particularly energy and metal prices) should also help underpin a sustainable recovery. This will be supported by efforts to improve budget positions and strengthen public sector governance, although broader institutional and structural reforms are still needed.
Part III: The Outlook for the Domestic Economy
In framing the forecasts for the domestic economy the exchange rate is assumed, as is usual practice, to remain unchanged from the average levels reached in recent months. On these assumptions, the exchange rate would be lower on average in 2000-01 than in 1999-2000, helping to support the forecast strong turnaround in net exports.
Similarly, interest rates are assumed to remain around current levels, with the forecasts taking into account the 125 basis point increase in official interest rates between November last year and May 2000. The increase is expected to have a moderating influence on some components of domestic demand, such as residential investment and household spending on consumer durables, although the timing and magnitude of this effect is uncertain.
The farm production forecasts are based on an assumption of average seasonal conditions over the remainder of 1999-2000 and in 2000-01.
Demand and Output
In 2000-01, economic growth in Australia is expected to be around 3 per cent. This will mean a further year of very solid growth with relatively low inflation, resulting in the unemployment rate declining to the lowest levels in a decade.
This favourable outlook follows three years of very strong growth. Estimates for 1999-2000 now have growth at 4 per cent, revised up from 3 per cent at MYEFO. As discussed further in Box 1, growth is estimated to have been broadly based across industry sectors in 1999-2000, with particularly strong growth in communications, and property and business services.
In 2000-01, domestic demand is expected to grow at a more moderate pace than in recent years, partly reflecting an unwinding of a net bring-forward of expenditure ahead of The New Tax System, the effects of recent increases in interest rates and a slowing in public final demand. At the same time, business investment is expected to grow more quickly than in recent years and net exports are likely to strengthen significantly as the world economy returns to solid growth, domestic demand moderates, and services exports receive a boost from the Olympics (see Box 3). The decline in the exchange rate over the course of 1999-2000 will also support net exports next year.
The New Tax System will provide substantial income tax cuts and increases in social security payments in 2000-01, with the impact on real household disposable income, and hence household consumption, only partly offset by overall increases in indirect taxes. However, it is likely that households are bringing forward consumption expenditure into the latter part of 1999-2000 to some extent, ahead of the changes to indirect tax arrangements. This means that this component of demand will be lower than otherwise in the early part of 2000-01.
Chart 3: Contributions to GDP Growth(a)
(a) Adjusted for transfers and one-off transactions as noted in Table 1.
Source: ABS Cat. No. 5206.0 and Treasury.
A similar pattern is occurring in residential construction, with strong activity in this sector in 1999-2000, ahead of an expected moderate easing in 2000-01. Growth in public final demand in 2000-01 is also expected to be below the growth rates recorded in recent years, reflecting moderate growth in public consumption and slower growth in public investment expenditure after two years of strong growth.
Importantly, one component of domestic demand expected to grow more quickly in 2000-01 than in recent years is business investment, which will be supported by the beneficial impact of The New Tax System on the price of investment goods and business costs, together with a stronger outlook for the world economy and relatively high levels of capacity utilisation.
Unemployment is expected to decline to 6 per cent by the June quarter 2001, offering the prospect of the unemployment rate falling thereafter to its lowest levels in a quarter of a century if the current macroeconomic policy framework and ongoing structural reform agenda are maintained.
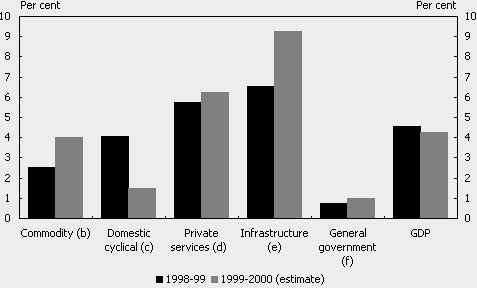
| Box 1: Industry Growth Prospects
As was the case in 1998-99, growth is estimated to have been broadly based across all main industry groups in 1999-2000. The infrastructure sector is again expected to have enjoyed the strongest growth in value added, reflecting very strong growth in the communications industry (see Chart 4). Private sector services are also estimated to have grown strongly in 1999-2000, and are forecast to make the largest contribution to GDP growth, driven by strength in property and business services, and finance and insurance. Industries with links to household consumption spending (such as wholesale and retail trade, and the consumer services sector) are also estimated to have enjoyed buoyant conditions in 1999-2000. Following a relatively weak outcome in 1998-99, the commodity sector is expected to have grown more strongly in 1999-2000, largely reflecting a strong turnaround in mining value added as new projects commenced operations. Farm sector output is expected to have grown only modestly in 1999-2000, by 3 per cent, despite above average seasonal conditions and an increase in crop area sown. Chart 4: Growth in Industry Gross Value Added(a)
Source: ABS Cat. No. 5206.0 and Treasury. Growth in the domestic cyclical sector (which includes the manufacturing and construction industries) is estimated to have slowed in 1999-2000 due to much slower growth in construction industry value added, with strong growth in dwelling investment offsetting a large fall in private non-residential construction activity. The manufacturing sector is expected to have grown only modestly in 1999-2000, with demand for manufactured products being met, in part, through a run-down of inventories. In 2000-01, more subdued growth is expected in the private services sector, in part due to the forecast slowing in household consumption expenditure. Construction activity is expected to fall in 2000-01, reflecting a fall in dwelling investment (as the bring-forward of dwelling investment is unwound) and a further fall in non-residential construction. The impact of the fall in construction value added on the domestic cyclical sector will only be partly offset by stronger growth in manufacturing, with domestic demand expected to remain solid and manufactured exports forecast to grow strongly. On the other hand, a strong outlook for mining exports will continue to support output growth in the commodity sector, while farm output is expected to grow by just 1 per cent in 2000-01, reflecting a return to more normal seasonal conditions and area planted, along with lower beef and veal production as the rebuilding of the herd continues. Growth in the infrastructure sector is again expected to be very strong, driven by the likelihood of continuing strong growth in the communications industry. |
Household Consumption
Growth in household consumption is expected to moderate slightly in 2000-01, to a still above trend rate of growth of 3 per cent, following several years of very strong growth.
Forecast solid growth in employment and a further fall in the unemployment rate will be supportive of consumption growth in 2000-01, as will the overall boost to real household incomes flowing from The New Tax System. The proposed demutualisation of the NRMA and forthcoming reductions in capital gains tax could also provide a fillip to household consumption growth in 2000-01.
On the other hand, asset prices and private sector wealth may grow less quickly, following several years of rapid growth, which partly reflected an environment of falling domestic and international interest rates (see Chart 5). Slower growth in wealth would reinforce the impact of recent increases in interest rates in moderating the growth in household consumption spending. Domestic and international equity prices have, in fact, declined modestly from earlier peaks, although they remain at historically high levels.
That said, the outlook for asset prices is always subject to considerable uncertainty, as is the precise impact of changes in interest rates and wealth on household spending decisions. For example, as outlined in last year’s Statement 2, household debt has increased relative to household income in recent years, potentially making households more responsive to interest rate changes. On the other hand, household assets have grown more quickly than debt, leaving the household sector’s balance sheet in a sound position.
Chart 5: Annual Growth in Real Private Sector Wealth
Source: Treasury.
The New Tax System will provide substantial income tax cuts and increases in welfare benefits in 2000-01, with the impact on real household disposable income, and hence household consumption, only partly offset by overall increases in indirect taxes. However, the changes to indirect tax arrangements on 1 July 2000 are also expected to result in some change to normal consumption patterns, as consumers bring forward consumption of some items that will rise in price and defer consumption of others that will fall in price. On balance, this is expected to result in a modest net bring-forward of household consumption into the latter part of 1999-2000, resulting in consumption in the first half of 2000-01 being a little lower than otherwise.
The magnitude of the bring-forward in household consumption is, however, subject to considerable uncertainty, with international experience with the introduction of a GST, particularly in New Zealand, suggesting that the magnitude of the assumed bring-forward may be conservative. If the bring-forward is larger than has been factored into the forecasts, then growth in household consumption in 1999-2000 would be stronger, at the expense of weaker growth in 2000-01. The bring-forward of household consumption could also be reinforced if households anticipate the forthcoming reductions in income tax. That said, recent softness in retail sales and measures of consumer confidence suggest that the expected bring-forward of consumption in the latter months of 1999-2000 could coincide with some moderation in ‘underlying’ growth in household consumption relative to the last couple of years.
Dwelling Investment
Following several years of strong growth, dwelling investment is expected to fall modestly by around 3 per cent in 2000-01, although remaining at high levels as a share of GDP.
Activity in this sector has been strong in 1999-2000, increasing by an estimated 6 per cent to an historically high level as a share of GDP. In part, this reflects a bring-forward of activity ahead of the changed indirect tax arrangements under The New Tax System. While first home buyers will be compensated for any increase in house construction costs associated with the new tax arrangements via the First Home Owners Scheme, there is likely to have been a net bring-forward of activity into 1999-2000 among other house builders and renovators. Partial indicators of dwelling investment, such as building approvals and housing finance approvals, rose sharply in the first half of 1999-2000 and remained at high levels during the early months of 2000.
An unwinding of this bring-forward of dwelling investment into 1999-2000 is likely to result in a modest decline in 2000-01. However, there is some uncertainty about the magnitude of the bring-forward, and the subsequent unwinding in 2000-01. It is also likely that dwelling investment will remain at a high level in the early part of 2000-01, as some ‘pre-GST’ construction activity slips into 2000-01.
Less supportive demographic factors and declining housing affordability, reflecting the combination of higher house prices and interest rates, are also expected to exert a moderating influence on dwelling investment in 2000-01. Nevertheless, ongoing solid growth in expenditure on alterations and additions to existing dwellings (in line with solid growth in household incomes and sound household balance sheets) and the beneficial impact of the First Home Owners Scheme should result in only a relatively mild fall in residential investment in 2000-01.
Business Investment
The sale and purchase of assets between the public and private sectors can have a significant impact on the published estimates of business investment and public final demand. This has been the case in recent years, as is evident from a comparison of Panels A and B of Table 1. Such asset sales have no impact on aggregate economic activity, but can provide a misleading view of trends in private and public investment. For this reason the following discussion of business investment abstracts from the purchase of second-hand public sector assets by the private sector.
Strong growth of around 6 per cent in new business investment is expected in 2000-01, following two years of slower growth (of 4.8 per cent in 1998-99 and around 3 per cent in 1999-2000). The favourable overall outlook for investment reflects supportive fundamentals: corporate profitability and balance sheets are healthy; measures of capacity utilisation are at high levels; and world growth and domestic demand are forecast to remain solid.
The forecast strength in overall business investment in 2000-01, however, masks significant differences between the components of business investment. New plant and equipment investment is expected to grow by a strong 9 per cent in 2000-01, reflecting: strengthening world activity and export demand; rising world commodity prices; pent up demand for plant and equipment (following two years of subdued growth); rising capacity utilisation (see Chart 6); and lower plant and equipment prices following the introduction of The New Tax System. The forecast for strong growth in plant and equipment investment in 2000-01 is broadly consistent with firms’ surveyed investment intentions from the Australian Bureau of Statistics’ (ABS) capital expenditure survey. That said, the recent softening in business confidence might suggest a slightly less rapid recovery in plant and equipment investment.
Chart 6: Survey Measures of Capacity Utilisation
Source: ACCI-Westpac Survey of Industrial Trends and National Australia Bank Quarterly Business Survey.
In contrast to the positive outlook for plant and equipment investment, investment in buildings and structures is expected to decline by 6 per cent in 2000-01, following an estimated decline of around 12 per cent in 1999-2000. Continued falls in non-residential building approvals and engineering construction commencements, and continued falls in the amount of work in the pipeline all point to a further decline in non-residential construction investment in 2000-01. Nevertheless, both building activity and engineering construction are likely to improve over the course of the year, with there being potential for further growth in investment in pipelines, power generation and telecommunications. Prospects also remain relatively favourable for investment in factories and other business premises.
The decline in non-residential construction in 1999-2000 and 2000-01 follows five years of strong growth in this sector, which carried it to an historically high level as a share of GDP. This growth was driven in part by construction associated with the Olympics as well as other infrastructure projects and a period of rapid investment growth in the mining sector. Even with the decline in 1999-2000 and that in prospect in 2000-01, activity in this sector will remain close to its historical average as a share of GDP in 2000-01.
The risks around the outlook for non-residential construction investment in 2000-01 seem evenly balanced. On the one hand, some leading indicators of activity in this sector may point to a larger than expected decline. On the other hand, strengthening world economic growth and rising commodity prices may flow more quickly than expected into stronger investment in the resources sector, although this seems more likely to impact in 2001-02 given the usual lags involved.
Investment in intangible fixed assets (that is, computer software, mineral exploration rights and artistic originals) is expected to continue to grow strongly in 2000-01, although at a slower rate than in 1999-2000. The outlook for intangible fixed assets is dominated by strong growth in investment in software which now comprises around 10 per cent of total new business investment. Some easing in growth in software investment is expected in 2000-01, following the completion of Y2K and the substantial completion of GST related work in 1999-2000.
Inventories
Private non-farm inventories are estimated to subtract a quarter of a percentage point from growth in 1999-2000, following rapid inventory accumulation in 1998-99 that appears to have returned the stocks-to-sales ratio to desired levels.
In 2000-01, inventories are expected to move broadly in line with sales growth, with the overall rate of inventory accumulation forecast to be similar to that in 1999-2000. As a result, private non-farm stocks are expected to make a zero contribution to GDP growth in 2000-01.
Farm and public authority inventories are expected to subtract a quarter of a percentage point from growth in 2000-01, largely reflecting a run down in public authority stocks in the September quarter 2000, as the cumulative increase in inventories resulting from transactions by the Sydney Organising Committee for the Olympic Games (SOCOG) is unwound (see Box 3).
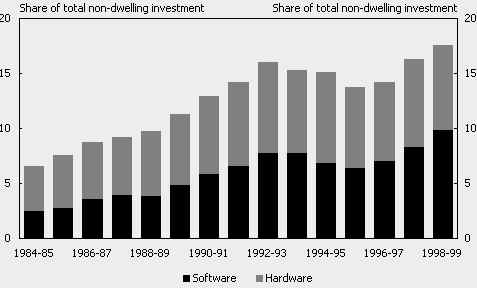
| Box 2: Investment in Information Technology
Economic reform has transformed Australia into a more open economy, which has created a favourable environment for increased entrepreneurship and innovation and, importantly, the diffusion of new technology. Indeed, there is likely to be a fundamental interplay between economic reform and the uptake of new technology, which has helped to underpin the structural improvement in productivity over the current economic expansion. One indicator of the rapid uptake of new technology by Australian businesses is the rapid growth in investment in computer hardware and software. This rapid growth in information technology investment has seen investment in computer hardware and software increase from 6 per cent of total non-dwelling investment in 1984-85 to around 17 per cent in 1998-99 (see Chart 7). Chart 7: Investment in Computer Hardware and Software(a)
(a) Share of total non-dwelling investment, current prices. |
Public Final Demand
In 2000-01, growth in real public expenditure is anticipated to slow to around 2 per cent in headline terms, and to around 2 per cent after adjusting for second-hand asset sales, following two years of strong growth. The slowing in public final demand is principally due to slower growth in real Commonwealth consumption, in part reflecting a levelling out of expenditure related to the peacekeeping mission in East Timor, outweighing an anticipated increase in consumption growth at the State/local level.
Investment at the State/local level is also expected to be weaker in 2000-01, after a period of strong growth, in part related to the Olympics.
Net Exports and the Current Account Balance
Net exports are expected to make a large contribution to GDP growth ( of a percentage point) in 2000-01, the first positive contribution since the East Asian financial crisis. This reflects stronger activity in the world economy, some moderation in domestic demand growth and a temporary boost from the Olympics (see Box 3). More generally, a lower average exchange rate in 2000-01 compared with 1999-2000 should support net exports by providing a boost to Australia’s competitiveness. The implementation of tax reform will also enhance competitiveness.
In 2000-01, export volume growth is expected to be around 7 per cent, following an estimated 9 per cent growth in 1999-2000. This is a significant improvement on the weak export volume growth in
1998-99 of around 2 per cent, reflecting the pick-up in growth among Australia’s trading partners. Such an outcome would return export volume growth to around trend following two years of below trend growth.
Export volume growth in 2000-01 is expected to be underpinned by strong growth in exports of services and elaborately transformed manufactures (ETMs). Services exports will be given a significant boost from the Olympics in 2000-01, particularly in the September quarter 2000, with further strength coming from increased tourist arrivals from East Asia. The volume of ETM exports — abstracting from the export of an ANZAC frigate in 1999-2000 — is expected to grow at around (pre-East Asian financial crisis) trend rates in both 1999-2000 and 2000-01. This reflects stronger world economic activity, in particular the recovery in demand from East Asian economies, as well as the recovery in New Zealand.
More moderate increases are expected in rural and non-rural commodity export volumes. The assumption of normal seasonal conditions in 2000-01 points to more moderate growth in rural commodity export volumes, following strong growth in 1999-2000. Resource exports are expected to grow solidly in 2000-01, a little below the growth rate in 1999-2000, but well above the flat outcome in 1998-99. The continued pick-up in the volume of resource exports primarily reflects additional supply capacity coming on stream, coupled with stronger growth in traditional export markets in East Asia. However, given the lead times usually associated with developing new resource projects, the recovery in commodity prices is expected to have only a moderate impact on resource export volumes in 2000-01.
Import volume growth in 2000-01 is expected to moderate to around 4 per cent, from an estimated 10 per cent in 1999-2000, in response to more moderate growth in domestic demand than in recent years and a significant fall in one-off imports (comprising, among other things, non-monetary gold and aircraft). Import volume growth in 2000-01 will also be affected by higher import prices, reflecting a pick-up in world producer prices and the lower exchange rate. However, experience over the past decade or so indicates that the relationship between world producer prices, the exchange rate and domestic retail prices of imported items is imprecise and difficult to predict. Competitive pressures, both at home and abroad, can have a strong influence on the outcome.
Following a significant decline of around 5.2 per cent in 1998-99, the terms of trade is expected to increase by around 3 per cent in 1999-2000 and a further per cent in 2000-01, but to remain below its mid-1997 level, prior to the onset of the downturn in Asia. This partly reflects the fact that, although firm growth in world GDP is expected, the level of world GDP is expected to remain below its trend path, following the below-trend growth of recent years. The fall in the terms of trade in through-the-year terms in 2000-01 largely reflects markets effectively bringing forward increases in prices for some of our major commodity exports into 1999-2000, while the adjustment in import prices in response to the strengthening world economy will impact more in 2000-01.
In US dollar terms, commodity prices — as measured by the Reserve Bank of Australia (RBA) commodity price index — have improved moderately through 1999-2000, after reaching a thirteen-year low in July 1999. Although the improving world economy should continue to have a positive influence on commodity prices in 2000-01, this is expected to be largely offset by increasing world supply of several of Australia’s key commodities. As a result, US dollar commodity prices are expected to remain well below their pre-East Asian financial crisis levels over the forecast period.
On the other hand, in Australian dollar terms, aggregate commodity prices are expected to average slightly above pre-East Asian financial crisis levels in 2000-01, reflecting the assumption of a lower average exchange rate than in 1999-2000 (see Chart 8).
Chart 8: Reserve Bank Commodity Price Index(a)
(a) The RBA commodity price index is based on the prices of 17 major commodities exported by Australia. Oil is not included in the series.
Source: Reserve Bank of Australia.
Significant increases in base metal prices have underpinned the moderate increase in US dollar commodity prices in 1999-2000. In US dollar terms, base metals prices have increased strongly through 1999-2000 in response to stronger global industrial production along with supply restrictions (see Chart 8). However, it should be noted that base metal prices comprise only 15 per cent of the RBA commodity price index. Looking ahead, base metal prices are expected to consolidate somewhat in 2000-01, as continued improvement in demand is broadly offset by increased supply. While a similar trend is evident for mineral fuels (namely crude oil, liquefied natural gas and petroleum products), the impact on the terms of trade is largely offset by crude oil imports.
For many other key commodities, increasing world supplies are offsetting stronger world demand. In particular, the outcome of recent negotiations for coking and steaming coal is for further falls in US dollar prices, on top of the very significant falls in the previous year. Further, while prices are improving for some key rural commodities (such as wool and beef), global overproduction (driven by the very high level of agricultural subsidies in developed countries) and high stock levels are depressing some rural commodity prices.
Chart 9: Contributions to the Current Account Deficit
Source: ABS Cat. Nos. 5302.0 and 5206.0, and Treasury.
The net income deficit (NID) has been relatively stable as a percentage of GDP since the onset of the East Asian financial crisis. In part this has reflected the decline in world interest rates. However, recent increases in world interest rates point to a small increase in the NID as a percentage of GDP over the forecast period.
The CAD is forecast to decline relative to GDP to 4 per cent (or $31 billion) in 2000-01, compared with around 5 per cent in the previous two years. Without the boost to services exports in 2000-01 from the Olympics the CAD would be expected to be closer to 5 per cent of GDP.
The overall increase in the CAD since 1996-97 primarily reflects a fall in the balance of trade (Chart 9), coming from weak net exports and weaker terms of trade during the East Asian financial crisis. The expected decline in the CAD in 2000-01 reflects a partial reversal of these factors. In keeping with past experience, however, considerable volatility is likely from quarter to quarter.
| Box 3: The Economic Impact of the Sydney Olympics
The staging of the Olympic and Paralympic Games in Sydney later this year will have a significant impact on the economy, particularly in the September quarter 2000. In addition, construction activity associated with the Games and expenditure by SOCOG has had an ongoing impact on economic activity over recent years. Direct Olympics related construction (that is, venues at Homebush Bay and elsewhere, the athletes’ village and associated transport infrastructure, such as the rail link and station at Olympic Park and roads at Homebus The Olympics are expected to have a significant impact on services exports and overall economic growth in the September quarter 2000. The sale of international broadcast rights, worth around $1 billion, will be recorded as a service export in the September quarter 2000. The sale of Olympic tickets to foreign tourists will also be recorded as a service export during the period of the games, regardless of when the tickets were actually purchased. In addition, other expenditures by foreign tourists, athletes and media attending the games will provide a significant boost to services exports in the first half of 2000-01, with the majority of the impact in the September quarter, although at least some will flow into the December quarter 2000. Overall, the Olympics are expected to add around $1 billion to services exports in 2000-01, with a fall in the CAD of around 1 per cent of GDP in the September quarter 2000. The Olympics are expected to have only a small impact on household consumption growth in year-average terms, as expenditure by Australian residents on Olympics related tourism should be largely offset by a decline in domestic tourism to other destinations and some crowding out of other spending. However, as Olympic ticket sales will be recorded in household consumption in the September quarter 2000, regardless of when the tickets were actually purchased, consumption in that quarter will be higher than it otherwise would have been. Only partly offsetting these positive impacts on growth will be a run-down of public authority inventories in the September quarter 2000. The value of SOCOG’s output less revenues received from sponsorship and consumer products has been recorded as an increase in inventories in the run-up to the Games, with these inventories then unwound in the September quarter. On balance, the Olympics of themselves are estimated to add around 1 percentage point to GDP growth in the September quarter 2000. The Olympic Co-ordination Authority (OCA) has estimated that around 35,000 people have worked on Olympic construction sites since work commenced at Homebush Bay in 1991-92. However, the net additional increase in employment is likely to have been somewhat less than this, as some of these workers would have found employment on other sites, or in other industries, in the absence of the Games. At this stage it is not clear whether the two-week period of the Olympics will see a strong rise in measured employment. In any event, the direct impact on employment during the period of the Olympics is likely to be temporary in nature. SOCOG is seeking around 40,000 volunteers for the period of the Olympics and 10,000 for the Paralympics. While unpaid volunteers are not typically classified as employed by the ABS in its Labour Force Survey, the provision of uniforms, food and drink and transport, as well as the opportunity to witness Olympic events raises the possibility that volunteers will in fact receive benefits in kind and could therefore be classified by the ABS as employed. SOCOG expects contractors to employ an additional 65,000 people (providing security, catering and cleaning services, for example). The impact of these (short-term) requirements on measured employment are uncertain and will depend on the ABS’s classification of volunteer workers and the extent to which positions are filled by persons already employed, as opposed to those classified as unemployed or not in the labour force. The ABS has also advised that it will conduct the September Labour Force Survey one week earlier than usual in New South Wales, which will put the ‘reference week’ two weeks prior to the commencement of the Games. The Olympics should also have a longer-term impact on employment in tourism and related industries, reflecting their promotional impact. |
Labour Market
Employment is expected to grow by a robust 2 per cent in 2000-01, following two years of above trend jobs growth. The unemployment rate is expected to maintain a downward trend, reaching around 6 per cent by the June quarter 2001.
This outlook follows estimated employment growth of 2 per cent in 1999-2000, significantly above the 2.2 per cent growth achieved in 1998-99. During the first half of 1999-2000, employment growth averaged around 22,000 per month, but has since moderated to around 19,000 per month. The major job advertisement and vacancy series all point to employment continuing to grow at a solid rate in the months ahead, albeit a little less rapidly than over the past year.
Ongoing employment growth and further reductions in unemployment are likely to encourage increased labour force participation over the period ahead, with the participation rate expected to edge up slightly to around 63 per cent by the June quarter 2001.
Despite recent increased labour force participation, strong employment growth has seen the unemployment rate fall to around its lowest level in a decade. Although some regional disparities exist, capital and non-capital city regions have experienced similar growth in employment and declines in unemployment rates over the past few years (see Box 4).
Volatility in the participation rate remains a key uncertainty around the unemployment rate forecasts, and hence the extent of tightness in the labour market in the period ahead. While forecast firm growth in employment should act to encourage greater labour force participation, demographic factors are likely to weigh against the ‘encouraged worker’ effect to some extent. The negative impact on the participation rate of the ageing of the population will increase as a growing proportion of the working age population gradually move into age cohorts where labour force participation is lower. This effect raises the possibility that the participation rate and unemployment rate could both be lower than forecast towards the end of the forecast period. On the other hand, a stronger than forecast encouraged worker effect cannot be ruled out. It is also possible that recent falls in housing affordability could encourage some second income earners back into the labour market, boosting the participation rate.
Some cyclical moderation in labour productivity growth from the very rapid pace in recent years is expected in 1999-2000 and 2000-01, with productivity growth (on a heads basis) forecast to be around 1 per cent in both years (increasing to 1 per cent through the year to the June quarter 2001). This follows the exceptionally strong productivity growth in 1997-98 and 1998-99, which in part reflected businesses’ uncertainty about the economic outlook (due to the East Asian financial crisis), resulting in slower employment growth than otherwise and hence higher labour productivity growth.
As noted in last year’s Statement 3, there has been an upturn in productivity growth evident in the current economic expansion and it is likely that the economy can sustain labour productivity growth averaging around 1 to 2 per cent per annum over the medium term, although with some short-term volatility of a cyclical nature around these average outcomes. This is supported by recent International Monetary Fund staff research1 which concludes that structural reforms have raised Australia’s sustainable productivity growth, thereby enhancing the growth potential of the economy
.
In recent years, there has been a diversity of experience across industries in terms of labour productivity. The strongest performing industries have been two which traditionally have been dominated by public enterprises, namely communication services and electricity, gas and water supply (utilities). These sectors have undergone substantial reform, through corporatisation and privatisation, and enterprise bargaining has become the predominant form of wage negotiation. The strongest productivity growth in the private sector has also been in those industries dominated by enterprise bargaining - mining, finance and insurance and manufacturing.
Wages
Wages growth continued at a moderate pace in 1999-2000, notwithstanding strong employment growth and a falling unemployment rate. Enterprise bargaining outcomes have declined and there is little evidence pointing to a significant increase in wage pressures.
On a national accounts basis, average earnings growth is expected to increase from an estimated 3 per cent in 1999-2000 to 4 per cent in 2000-01. The increase in the superannuation guarantee charge on 1 July 2000 accounts for part of the stronger forecast, while the remainder can be attributed to a gradual tightening of labour market conditions over the next year and the increase in wages flowing from the recent ‘Living Wage Case’ decision of the Australian Industrial Relations Commission.
In some sectors, large wage increases, shorter working weeks and more restrictive work practices are being sought or have been achieved. While these pressure points are an important ongoing issue for the wages outlook, these negotiations have affected relatively few employees to date, and institutional changes and competitive pressures should limit the spread between sectors.
A key uncertainty around the forecast for wages growth in 2000-01 is the potential impact of declining unemployment on the availability of skilled labour. Skill shortages have been apparent for some time in selected sectors and regions. However, these have not increased significantly over the past year and, indeed, may be abating in some sectors. While additional pressures may develop, there is little evidence to date to indicate that skill shortages will become sufficiently widespread in the year ahead to generate excessive wages growth across the economy.
While changes to indirect tax arrangements under The New Tax System will have an impact on prices, there is no rationale for higher wages to ‘compensate’ for these price effects, given the significant personal income tax cuts and increased social security payments contained in the tax reform package. There is neither evidence of widespread inclusion of GST related clauses in new enterprise agreements, nor that the implementation of tax reform will have a significant impact on wage negotiations. These issues are discussed more fully in Statement 3.
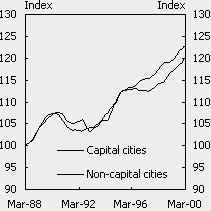
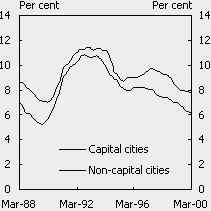
| Box 4: Recent Developments in Regional Labour Markets
In aggregate, regional Australia has benefited from the economic expansion of the 1990s through increased employment and lower unemployment. However, as in the capital cities, the experience has been diverse, with some regional areas experiencing high unemployment rates, while others have unemployment rates well below the national average. Chart 10 shows that, but for the two years between mid-1995 and mid-1997, employment growth in non-capital city labour markets has matched that in capital cities. The unemployment rate in capital cities has been around 1 percentage point lower than non-capital city regions over much of the period (Chart 11). Over the past three years the fall in non-capital city unemployment has closely matched the fall for capital cities. There are some broad patterns in the disparities in employment growth and unemployment rates between regions. Non-capital city regions reliant on traditional industries such as mining, agriculture and electricity generation have had slow employment growth and continue to experience high rates of unemployment. Agricultural areas specialising in horticulture or viticulture, as well as tourist and coastal regions of Australia, have experienced strong employment growth and significant declines in their unemployment rates. |
||
Chart 10: Employment Index(a)(b) |
Chart 11: Unemployment Rates(a)(b) |
|
|
|
|
|
|
(a) Trend data. |
||
Prices
In 1999-2000, inflation is estimated to be around 2 per cent in year-average terms, although it is likely to be around 3 per cent through the year to the June quarter 2000 due to the temporary effect of international oil price fluctuations. This follows very low inflation outcomes over the previous three years.
The increase in inflation in 1999-2000 reflects several factors. As noted above, the sharp rise in world oil prices during 1999 and the early part of 2000 has been passed through to petrol prices (see Chart 12), which has increased the CPI by almost a full percentage point through the year to the March quarter 2000.
Chart 12: Oil and Petrol Prices
(a) Weighted average retail pump price of unleaded petrol in the eight capital cities.
Source: ABS Cat. Nos. 6401.0 and 6403.0, Datastream and Treasury.
At the same time, gradual increases in other world commodity prices following the sharp decline during the East Asian financial crisis are putting some upward pressure on production costs at home and abroad. Recent rises in prices of project homes in response to very strong activity in that sector ahead of the changes to indirect tax arrangements under The New Tax System have also contributed to the increase in the CPI in 1999-2000.
Changes associated with The New Tax System have also made a small direct contribution to the increase in the CPI in 1999-2000. The move to per-stick taxation of cigarettes has added almost a quarter of a percentage point to the through-the-year increase in the CPI, only partly offset by the reduction in WST on a range of items from 32 per cent to 22 per cent on 29 July 1999.
Leaving aside the direct effects of The New Tax System on consumer prices, ongoing inflation is expected to be around 2 per cent in year-average terms in 2000-01 and around 2 per cent through the year to the June quarter 2001. The estimate for ongoing inflation in 2000-01 includes some allowance for the impact on consumer prices of a lower exchange rate which is assumed would prevail in
2000-01 in the absence of The New Tax System. This is because, without the beneficial impact of The New Tax System on business costs, Australia’s exporting and import-competing industries would be less internationally competitive.
The outlook for ongoing inflation also takes into account the expected modest step-up in wages growth in 2000-01 and an expected easing in productivity growth from the very rapid pace of recent years, which will see nominal unit labour costs rise a little over the period ahead (see Chart 13). That said, the low inflation outlook in 2000-01 will continue to be supported by the structural improvement in Australia’s productivity performance over recent years.
Chart 13: Ongoing Inflation and Nominal Unit Labour Costs
(a) Excludes the impact of The New Tax System on prices.
(b) Trend measure.
Source: ABS Cat. Nos. 6401.0 and 5206.0, and Treasury.
The stronger world economy, higher world prices for some commodities and the decline in the Australian dollar since the start of the year could also add some upward pressure to import prices. While the earlier decline in the exchange rate, during the East Asian financial crisis, did not result in higher retail prices for imported items, some of the global deflationary forces that contributed to that outcome are likely to have waned over the intervening period, reflecting the recovery in Asian economies and a return to around trend rates of growth in the world economy. On the other hand, with world oil prices now falling, the impact of higher petrol prices on the CPI in 1999-2000 is expected to be partly reversed in 2000-01. Underlying cost and price pressures in the residential construction sector are also expected to moderate to some extent in 2000-01 as activity in that sector declines.
The changes to indirect tax arrangements under The New Tax System are estimated to increase the CPI by around 2 per cent through the year to the June quarter 2001. The main effects will occur in the September quarter 2000 as the impact of the GST on retail prices is only partially offset by the direct impact of the removal of WST on final consumer items. While estimating quarterly outcomes is inherently difficult, the overall increase in the CPI in the September quarter could be of the order of 4 per cent, of which a little over 3 per cent would reflect one-off price changes associated with indirect tax reform.
In subsequent quarters, increases in the CPI will be smaller than would otherwise have been the case, as the removal of embedded WST and lower business costs put downward pressure on retail prices.
Taking together the estimate of ongoing inflation and the impact of The New Tax System on prices, the CPI is forecast to rise by around 5 per cent in year-average terms in 2000-01 and 5 per cent through the year to the June quarter 2001.
These estimates are based on an expectation that, with income tax cuts boosting take-home pay and more than compensating households for the impact of indirect tax reform on prices, there will be no flow-on of the increased indirect taxes into wage costs.
The overall impact of The New Tax System on the CPI will be less than the impact in 2000-01. Further measures will be introduced in 2001, 2002 and 2005 that will reduce the overall CPI impact of the package, including the removal of Financial Institutions Duty and Bank Account Debits taxes and the phasing-in of input tax credits for motor vehicles.
Statement 3 contains more detailed information on the expected CPI impact of The New Tax System.
Part IV: Uncertainties
The outlook for inflation in 2000-01 will depend heavily on whether prospective solid productivity growth and moderate wage outcomes are achieved as the unemployment rate falls further, and on whether the economy begins to face significant capacity constraints more generally as it enters a tenth year of economic expansion. There is evidence of some labour market tightness in particular sectors and regions, although there is little clear sign of a general increase in wage pressures. While the structural rate of unemployment in Australia is difficult to estimate with any degree of certainty, it is likely to have fallen during the 1990s as the labour market has responded to a range of reforms.
The risk that wage pressures will begin to build will increase if the unemployment rate falls rapidly or if overall activity is appreciably stronger than forecast. While there is currently little evidence to suggest that wage bargainers are attempting to seek a ‘second layer’ of compensation for price effects associated with indirect tax reform (that is, on top of the substantial income tax cuts and increases in social security payments), ensuring wages outcomes do not build in this ‘over-compensation’ will be important in sustaining low inflation and strong growth (see Statement 3).
The impact of the recent decline in the exchange rate on consumer prices also poses some uncertainty to the outlook for ongoing inflation. While rises in ‘over-the-docks’ import prices had little impact on retail prices of imported items during the East Asian financial crisis, the recovery in the global economy and the reversal of some of the global deflationary forces since then raises the possibility that changes in import prices could be reflected in consumer prices more quickly over the period ahead. The impact of exchange rate movements on final retail prices of imported items also depends, importantly, on how long any particular level of the exchange rate is sustained.
There is also some uncertainty surrounding the profile of activity in the latter part of 1999-2000 and the first half of 2000-01. The introduction of The New Tax System is expected to result in a net bring-forward of household consumption and dwelling investment into 1999-2000 that will more than offset a net deferral of business investment into 2000-01. However, the magnitudes of these bring-forwards and deferrals are uncertain. A stronger than expected net bring-forward of activity prior to the introduction of the GST on 1 July 2000 may see growth in 1999-2000 stronger than forecast, at the expense of weaker growth in 2000-01. It will, however, be difficult to untangle GST induced bring-forwards and deferrals from ongoing demand and output growth, which will make assessing underlying trends in the economy particularly difficult over the next few quarters. The Sydney Olympics will also add some uncertainty to the profile of demand and output in the second half of calendar 2000.
The recent softness in retail sales and measures of consumer confidence also suggest that the expected bring-forward of consumption in the latter months of 1999-2000 could coincide with some moderation in ‘underlying’ growth in household consumption relative to the last couple of years.
The outlook for business investment, particularly non-residential construction, is also uncertain. While the forecasts incorporate significant falls in non-residential construction in both 1999-2000 and 2000-01, some forward indicators of activity in this sector point to much larger falls. On the other hand, the impact of a strengthening world economy on non-residential construction (particularly mining related construction) is difficult to assess and it is possible that activity might recover more quickly than anticipated in 2000-01.
While world growth is expected to strengthen further in 2000, there are uncertainties surrounding the outlook, particularly in 2001. The pattern of growth over the forec
ast period is projected to alter — with the US easing and Japan and Europe strengthening — and there is some risk that the adjustment could be sharper than expected and have broader effects. This could arise, for example, if inflationary pressures were stronger than anticipated, particularly in the US, and to a lesser extent Europe, necessitating strong macroeconomic policy responses. Alternatively, strong productivity growth could sustain high rates of growth in the US for a longer period.
The recovery in Japan continues to be fragile and significant uncertainty remains around the outlook for 2001. The strength and sustainability of the recoveries in the East Asian economies depends on the timely and effective implementation of structural reforms, particularly in the financial and corporate sectors, as well as the world outlook. While the outlook for Russia and most of the emerging economies of Latin America has improved, vulnerabilities remain and it is important that continued steps are taken to lessen the impacts of such risks, such as by improving budgetary positions and public governance.
1 Australia: Selected Issues and Statistical Appendix, Series: IMF Staff Country Report No. 00/24, 6 March 2000.