Steven Kennedy and Alicia Da Costa1
Over the past five years, the labour force participation rate of older Australian men has risen after declining for over 25 years. In combination with ongoing increases in older women’s participation, the participation rate of older persons is now at its highest level on record. We describe some of the trends in older persons’ participation with a focus on older men and discuss some possible reasons why older men’s participation has reversed its long decline. We find that improved labour market conditions for older workers is the most likely explanation for the recent increase in participation but that the increase is supported by long-lived improvements in health and education.
Introduction
Over the past five years, there has been a significant reversal of a long trend in older men’s labour force participation. After declining steadily for over 25 years, participation by older men (which we define as men aged 55 to 64 years) began increasing around 2000, to be currently at levels not seen since 1980 (Chart1). The recent increase is most dramatic for men aged 60 to 64 years, although the increase for men aged 55 to 59 years is also significant. In combination with the continuation of the 30-year upward trend in women’s participation, older persons’ participation is now at its highest level on record.
Chart 1: Labour force participation of older persons
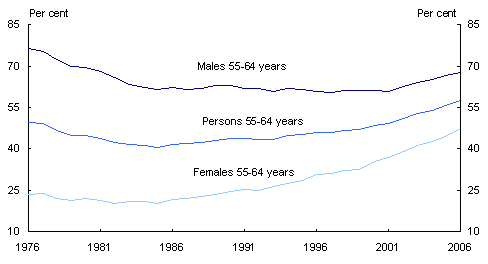
Note: Estimates for 2006 are based on data available until September 2006.
Source: Australian Bureau of Statistics 2006, Labour Force, Australia, Detailed, cat. no. 6291.0.55.001, Canberra (ABSLabour Force Statistics); Australian Bureau of Statistics 1978, The Labour Force, Australia 1978 (including revised estimates from August 1966), cat. no. 6204.0, Canberra; authors’ calculations.
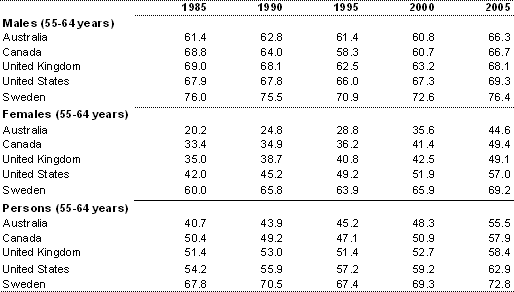
The re-emergence of older male workers is not just an Australian phenomenon. In the United States, the United Kingdom, Canada and Sweden older men’s participation has also increased over the past five to ten years. Along with continuing rises in female participation, older persons’ participation rates are rising in all these countries (Table1).
Table 1: International comparisons of participation rates for older persons
Source: Organisation for Economic Co-operation and Development (OECD) 2006, Labour Force Statistics, 1985-2005, OECD Publishing.
What should we make of this development? Are we witnessing the first behavioural responses of employers to ageing populations or does the increase in participation of older persons reflect the different behaviours and preferences of the post-war baby boom generation who started comprising older age groups around the turn of the century?
This article sheds light on these and other questions by describing the recent trends in older Australians’ labour force participation and by exploring a number of pathways through which participation may be affected. The focus of the article is on older men’s participation, as their trend behaviour has altered most significantly. However, older women’s participation is also discussed, particularly as labour force participation decisions are most often made jointly in a household rather than by ‘textbook’ individuals.
Describing older persons’ labour force participation
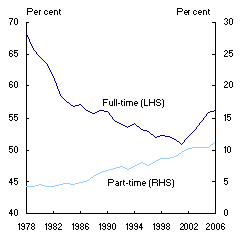
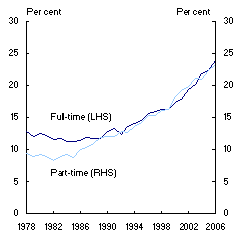
Underlying the increase in older persons’ labour force participation has been a strong rise in part-time participation for men and women.2 For example, around half the overall increase in older women’s participation over the past two decades has been in part-time participation. The recent increase in older men’s participation has also reflected ongoing rises in part-time participation. However, there has also been a significant turnaround in full-time participation, which has driven the overall increase in participation for older men. The recent sharp rise in older men’s full-time participation comes after 25 years of falls and is occurring at the same time as part-time participation continues to rise at roughly the same rate as it has over the past two decades (Chart 2).
|
Chart 2: Full-time and part-time participation rates for older persons |
|
|
Males 55-64 years |
Females 55-64 years |
|
|
|
Source: ABSLabour Force Statistics; authors’ calculations.
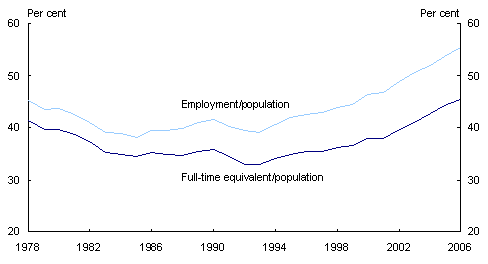
In combination with low unemployment, the increase in older persons’ participation has led to record levels of older persons’ labour input. Chart 3 shows two measures of labour input, employment and full-time equivalent employment, both as a share of population. The latter shows that, even after adjusting for the increase in part-time employment, the overall labour input of older persons is still at a record level.
Chart 3: Employment to population ratios for older persons (55-64 years)
Source: ABSLabour Force Statistics; authors’ calculations.
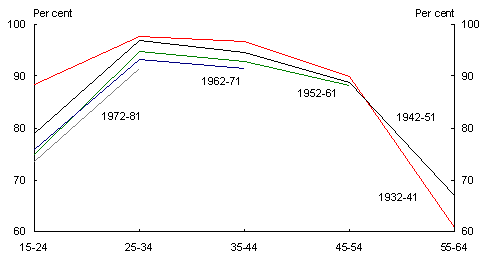
Over time, the labour force participation of different age groups reflects the experiences of different cohorts of individuals. Chart 4 shows labour force participation rates across the lifecycle for different (birth) cohorts. For example, the chart shows for men born between 1942 and 1951 their participation at age 15 to 24years in 1966, then 25 to 34 years in 1976 and so on until they are aged 55 to 64 years in 2006.
Chart 4: Male labour force participation by birth cohort
Source: ABSLabour Force Statistics; ABS Census; authors’ calculations.
The chart shows that younger cohorts of men (men born more recently) have consistently had lower participation than older cohorts.3 However, there has been one significant exception to this pattern of behaviour. In particular, the recent increase in older men’s participation does not appear to reflect a time persistent cohort effect — that is, where the ageing of a high participation cohort leads to a lift in older age group participation rates. This is reinforced by the fact that the cohort of men born between 1942 and 1951, who currently comprise the 55 to 64 years age group, have higher participation r
ates than the previous cohort only in the 55 to 64 age range.
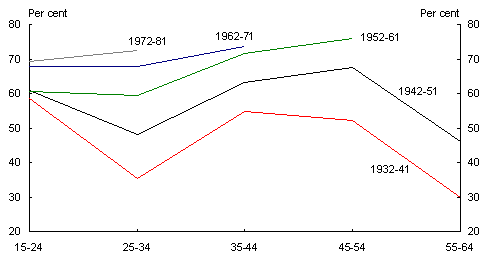
In contrast to men, younger cohorts of women have had progressively higher participation rates than older cohorts, which have persisted across the lifecycle (Chart5). This suggests that the upward trend in older women’s participation will persist for some time yet, with higher participation at younger ages likely to lead to higher participation at older ages.
Chart 5: Female labour force participation by birth cohort
Source: ABSLabour Force Statistics; ABS Census; authors’ calculations.
Explaining the recent increase in older men’s participation
The possible explanations for the recent increase in older men’s participation can be categorised broadly into: supply side explanations including the role of wages and other economic incentives in influencing people’s behaviour, and the characteristics of labour; demand side explanations including employers’ perceptions about the value of older persons’ labour input; and market efficiency and labour dynamics, which characterises the way supply and demand for labour interact.
Wages, wealth and pensions
The key economic incentive for people to supply labour is the wage they receive in return. An increase in (real) wages will have two effects. First, as the person has more income, they need to work less to maintain their consumption possibilities; this is called the income effect. Second, as the cost of leisure or earnings forgone from not working increase, people tend to work more, known as the substitution effect. With the two effects working in the opposite direction, the labour supply outcome of an increase in wages is theoretically ambiguous.
In addition to the effect of wages, a person’s wealth will also affect their decision to participate in the labour force. This is particularly relevant for older persons where a decision not to participate may effectively represent retirement from the labour force. In this case, people are weighing up their ability to enjoy more leisure now while maintaining a desirable standard of living through their retirement. An increase in wealth would tend to suggest earlier retirement as it essentially reflects the same impact as the income effect associated with an increase in wages.
Over the past five years, there has been a large increase in the wealth of older Australians, reflecting initially the housing boom followed by significant growth in financial wealth driven by the mining boom. This would tend to reduce the participation of older workers and would not explain the recent increase in participation of older men.
Another aspect of income in retirement is the provision of old age public services and pensions. Research published by the OECD (2006) highlights the important role of rules governing access to retirement benefits and the incentives generated by retirement income programmes. For example, the increase in the age pension in Australia through the 1970s is thought to explain a large portion of the ensuing drop in the participation of men aged 65 years or more (Merrilees 1983). Moreover, the fall in participation of men aged 60 to 64 years in the early 1980s was influenced by WorldWar II veterans qualifying for the war service pension. Over the past 10 years, there have been no large changes in the relative value of or access to age pensions for males, which suggests that the age pension has not been an important factor in explaining the recent increase in older men’s labour force participation.
Access to other pensions such as the Disability Support Pension (DSP) has clearly affected the participation of older males. Over the 1980s and 1990s the number of men on the DSP aged between 50 and 64 years rose to a peak in 1996 of 15.3 per cent of the age group. The proportion of men aged 50 to 64 years on the DSP stabilised around the mid-1990s and has been falling steadily since late 1990s. Recently, there have been changes to the DSP, which tighten access and encourage workforce participation. While these changes are probably not yet having a large effect on participation, they may be playing a small role.
Recent policy changes to taxation and superannuation access may also provide incentives for older persons to remain in the workforce longer. The Mature Age Worker Tax Offset, introduced in July 2004, provides an annual tax rebate for persons aged 55 or over who choose to remain in the workforce. From July 2005, persons aged 55 years or over have access to their superannuation in the form of a non-commutable pension while still working. Additionally, from 1 July 2007, superannuation benefits will be tax free or subject to a reduced rate of tax after age 60.
Worker and household characteristics
Poor health is the most commonly cited reason why people retire from the labour force. The 2003 HILDA survey found that 42 per cent of people aged 45 years or more cited medical advice or health reasons as the primary reason for retiring or partly retiring. With the average health of the population improving over time, we would expect participation to rise in older age groups. However, this long-lived change is likely to be at best only a small part of the recent increase in older men’s participation and does not explain the long-term decline that preceded the increase.
It is well established that people with higher educational qualifications participate more in the labour force. Kennedy and Hedley (2003) show that the labour force participation of men with some post-school qualifications is around 10 percentage points higher than for those without post-school qualifications for most age groups. As the labour force becomes more highly educated, we would expect the participation of older workers to increase although, as for many of the supply side explanations, this would not explain the earlier longer-term decline in men’s participation and the recent increase.
Decisions to either retire or continue to participate in the labour force are most often made jointly in a household. Around 75 per cent of people aged 55 to 64 years are married. The increase in women’s labour force participation may be positively affecting men’s participation. In this case, men may be choosing to continue working while their spouses work and then retire together. With married women on average around 2 to 3 years younger than their spouses (Qu 1998) and with women’s participation increasing over many years, this may be beginning to affect men’s participation.
Countering this effect may be the substitution of one household member’s labour income for another. If households are deciding that they have enough income with one member working, and the younger female partner finds maintaining employment easier, then increasing female participation could have tended to reduce male participation. As one might have hoped, ‘there appears to be compelling international evidence of an important effect of the value that spouses place on spending time with each other on joint retirement decisions’ (Borland 2005). In other words, the positive effects of women’s participation on men’s participation are likely to dominate the negative effects.
An important reason for why older men may be participating more in the labour force is a change in preferences. Baby boomers (those born between 1946 and 1962) have progressively comprised a larger portion of the older age groups since 2000. Baby boomers may be taking a different attitude to working in their later years and they may have a different set of income expectations for retirement. That is, they expect to live longer and in better circumstances than previous generations. The size of this effect is hard to gauge although it is striking
that the improvement in older men’s participation began as baby boomers began entering these age groups.
Demand for older male workers
Many studies of older men’s participation focus on supply side aspects such as the economic incentives to supply labour. However, some studies find an important role for demand side factors. O’Brien (2000) finds that hidden and high unemployment rates were an important aspect of falling older men’s participation over recent decades.
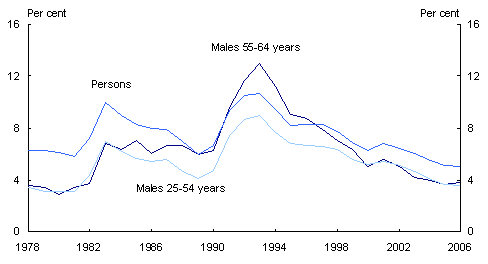
Chart 6 shows unemployment rates for older men over the past 20 years and it is clear that older men were particularly adversely affected by the rise in unemployment during the early 1990s recession. The comparison between unemployment rates for older men and those aged 25 to 54 years is especially stark, and illustrates that the early 1990s marked a nadir for older males in terms of labour market outcomes. For the rest of the population, it was more of a repeat of the unemployment experience of the early 1980s.
Chart 6: Unemployment rates
Source: ABSLabour Force Statistics; authors’ calculations.
In part, very high older male unemployment rates reflected a succession of large structural changes to the Australian economy through the 1980s, as inefficient and protected industries were swept away and competitive industries emerged. Unfortunately for older men, the industries most affected by both the recession and structural changes were those where they tended to be employed. For example, between 1989 and 1995 employment in the manufacturing industry fell by 8per cent, with, in 1989, manufacturing accounting for around 21 per cent of older men’s employment. This situation was further exacerbated by the fact that it was more difficult for older men to re-train and find other employment compared with younger men.
Unemployment rates for the general population are at 30-year lows; those for older men are even lower, which highlights the dramatically improved labour market conditions for these workers. Adding further to this point, these unemployment rates are being achieved by older men while their participation rates are rising.
Attitudes and employers’ preferences also play a role in older men’s participation in the labour force. The existence of legislation in a number of countries to prevent discrimination based on age is evidence of these factors at play (OECD 2006). A number of studies have shown that employers consider older workers to be less productive (see Borland 2005 for a review of recent studies). To date, there has only been limited evidence of a change in attitudes toward older workers, although initiatives by organisations such as the Business Council of Australia in promoting the value of older workers are a sign of change.
Labour market efficiency and dynamics
We noted earlier that there have been substantial long-term changes in the structure of employment for older men, with part-time employment becoming increasingly prevalent until more recently. While the recent turnaround in older men’s participation reflects significantly improved outcomes for full-time participation, the long-term increase in part-time work may still reflect the preferences of older workers. That is, they may prefer part-time work as part of a transition to retirement. This is supported by ABSdata for 2005, which show that for men aged 25 to 54 years working part-time, around 41 per cent would like more hours of work compared with around 24 per cent for those aged 55-64 years.
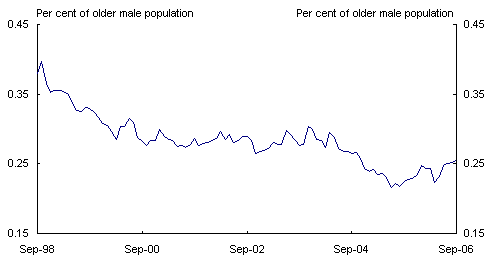
An aspect of the older work force is their increased propensity to leave the labour force if they are retrenched (Borland and McDonald 2001). While recent data on the retrenchment of older workers are not readily available, we can examine labour force flow data to see if fewer older workers have been moving labour force states or in particular, been exposed to spells of unemployment. Chart 7 shows that there has been a fall in the flow from employment to unemployment for older men. This suggests that the recent strength in the labour market has reduced employment exit rates and has lessened the potential for opportunistic or unplanned retirement; that is, retiring once one loses one’s job.
Chart 7: Flows of older men from employment to unemployment (55-64 years)
Source: ABSLabour Force Statistics; authors’ calculations.
Summary
The recent increase in older persons’ labour force participation is a welcome development and bodes well for the improved circumstances of older persons both now and when they retire. It is also a positive sign for future economic growth as Australia’s population continues to age. Moreover, recent policy changes to taxation and superannuation access should support ongoing increases in older persons’ participation.
There are many reasons for the increase in participation of older persons and, in particular, the recent increase in older men’s participation. The general improvement in labour market conditions for older men, especially in full-time employment outcomes, appears to be playing an important role. In combination with long-term factors such as improving education and health, we may well see even higher participation rates among older Australians in the future. It is noteworthy that despite the participation rates of older Australians being at record levels, they have not yet reached the levels of a number of countries including the United States, UnitedKingdom, Canada and Sweden.
References
Blau, DM 1994, ‘Labor force dynamics of older men’, Econometrica, vol 62, no. 1 pp117-56.
Borland, J 2005, ‘Transitions to retirement: a review’, Melbourne Institute Working Paper no. 3/05, Melbourne Institute of Applied Economic and Social Research.
Borland, J and McDonald, T 2001, ‘Displaced workers in Australia 1984-1996: macroeconomic conditions and structural change’, Department of Economics Research Paper no. 824, University of Melbourne.
Heady, B, Warren, D and Harding, G 2006, Families, Income and Jobs: a Statistical Report of the HILDA Survey, Melbourne Institute of Applied Economic and Social Research.
Kennedy, S and Hedley, D 2003, ‘A note on educational attainment and labour force participation in Australia’, Treasury Working Paper no. 2003-03.
Merrilees, WJ 1983, ‘Pension benefits and the decline in elderly male labour force participation’, The Economic Record, vol 59, September, pp 260-70.
O’Brien, M 2000, ‘Older male labour force participation: the role of social security and hidden unemployment’, Australian Journal of Labour Economics, vol 4, no. 3, pp 206-23.
OECD 2006, Live Longer, Work Longer, OECD Publishing, Paris.
Qu, L 1998, ‘Age differences between brides and grooms in Australia’ Family Matters no. 49, Autumn, Australian Institute of Family Studies.
Ravindiran, R 2003, ‘Unemployment and participation rates: a cohort analysis’, Australian Labour Force Statistics, July, Australian Bureau of Statistics.
1 The authors are from the Domestic Economy Division, the Australian Treasury. This article has benefited from comments and suggestions provided by Sandra Dandie, David Gruen, Jason Harris, JohnHawkins, Rob Heferen, Anthony King, Lan Lu, Paul McMahon, DavidParker and Jyoti Rahman. The views in this article
are those of the authors and not necessarily those of the Australian Treasury.
2 The full-time participation rate is the share of the population who are employed full-time or unemployed and seeking full-time work, while the part-time participation rate is the share working part-time or unemployed and seeking part-time work.
3 Ravindiran (2003) found significant ‘cohort’ effects for men’s participation and that these were leading to lower participation.
