Janine Murphy1
‘The function of protecting and developing health must rank even above that of restoring it when it is impaired.’ Hippocrates
The health of the workforce is an important factor in sustaining and potentially enhancing participation. Ill health is a major factor in cessation from paid employment and decisions around early retirement. As the population ages, improving and maintaining health will become increasingly important for personal wellbeing, improving labour force participation and productivity as well as containing the growth in health expenditure.
On current trends, health costs will become an increasing share of the economy as health costs increase with rising real incomes and as the population ages. More sophisticated treatments and diagnostic techniques have enhanced both the length and quality of life for people, particularly the elderly, but are expensive and add to cost pressures.
Using diabetes Type 2 as a case study, this paper focuses on the argument that greater emphasis on population-based measures to prevent, reduce or delay the onset of lifestyle-related chronic illness is likely to enhance and extend labour force participation and increase productivity as the population ages and thereby increase economic growth. Moreover, by enhancing the general health and independence of the ageing population such measures may also contain the associated projected growth in health and aged care expenditure.
Introduction
Health is among the most important contributors to the wellbeing of the Australian people. Good health provides the capability to undertake employment, engage with friends, family and society more generally and enjoy recreational opportunities. Good health extends the expected length of life available, making new long-term goals achievable and long-term investments desirable, and reduces uncertainty.
This paper examines the impact of ill health on workforce participation and productivity. It highlights the increasing incidence of lifestyle-related chronic disease within the population. As chronic conditions tend to develop and progress with age (Figure 1) they are a significant cause of reduced labour force participation among mature workers, leading to early retirement. In addition, if unchecked, those diseases are likely to become major contributors to the projected growing cost of health care as the population ages.
Figure 1: Age-specific reporting of two or more long-term conditions, 2001
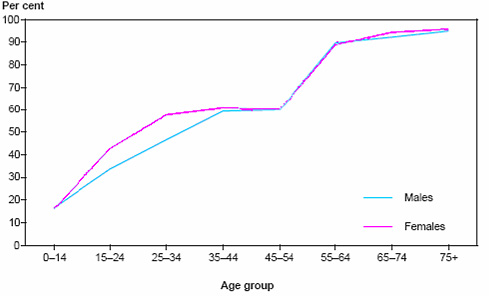
Source: Australian Institute of Health and Welfare, 2004 Australia’s Health 2004, p. 35.
Using Type 2 diabetes as a case study the paper draws out some direct relationships between the lifestyle-related causes of the disease, its progression and the impact on workforce participation, productivity and health care costs. It provides evidence that expenditure that focuses on reducing the lifestyle-related causes of the disease is likely to be more cost-effective than treating the disease once it has been diagnosed. Moreover, preventing the disease, by reducing the lifestyle-related causes, will have additional benefits for labour force participation and productivity.
Health and labour force participation and productivity
From a macroeconomic perspective, good general health raises income by increasing the proportion of society that is capable of participating in the labour force and by boosting labour productivity, both directly and indirectly, by encouraging investment in human and physical capital. In that sense the development of human capital through investment in health (both personal and formal health care) is considered analogous to investment in education. Both act to increase productivity in both market and leisure activities. The key differences are that good health also extends the healthy lifespan of an individual and probably reduces the rate at which people discount the future, at least at older ages.
The theoretical effect of health on labour market outcomes is fairly ambiguous. The theory suggests that healthy workers should be more productive and so receive higher wages. However, health also increases the return from leisure and other non-market activities so there need not be a strong substitution to paid labour. In Australia, the existence of an income support safety net, publicly provided health care and legislated minimum wages, while providing valuable assistance to those with poor health, can also act as a disincentive for them to participate in the labour force.
Theory suggests that health is also a key driver of retirement decisions. Given an initial level of wealth, those that are healthier would be expected to work for longer in order to fund a longer retirement. While the theory seems sound, this is difficult to observe in the data because wealth is typically closely correlated with health.
Deteriorating health is probably a better predictor of labour force participation at older ages than poor health per se since many of those that have suffered poor health over extended periods have already adjusted their lives and careers accordingly (Bound et al, 1998 and Chan and Stevens, 1999). Deterioration in health significantly influences the retirement expectations of those currently working and for the average older worker the effect is far stronger than other variables such as changes over time in income or wealth (McGarry, 2002). In Australia the means-tested age pension, which is equivalent to 25percent of male total average weekly earnings, and access to other income support payments and/or superannuation savings before age pension age, frequently enable even the less wealthy to retire early, particularly if their health deteriorates.
The relationship between deteriorating health and participation also depends in part on the worker’s skills and occupation. High-stress occupations, for example, are more likely to lead to those with ill health leaving the workforce. However workers with well-developed and portable skills may more easily move into jobs that are more accommodative of their health issues than those with few skills or with job-specific skills only. International studies suggest that, for the same level of disability, those in less skilled occupations show a greater rate of departure from the labour force, as do those in more physically demanding occupations (Berkowitz and Johnson, 1974 and Grady and Hayward, 1986).
For these reasons, in Australia we would expect to see a stronger negative relationship between labour force participation rates and health within older age groups than within younger age groups. Consistent with this hypothesis, Table 1 presents recent data from the Household, Income and Labour Dynamics in Australia (HILDA) survey. While there are only modest differences between the participation rates of those with excellent, very good or good health, those with fair or poor health have far lower rates of participation. This trend is more pronounced for those in older age groups and is more pronounced for women than for men.
Table 1: Participation rates by age, gender and self-assessed health status
| Not in labour force for health reasons% |
Self-assessed health of those in labour f orce*% |
|||||
|---|---|---|---|---|---|---|
| Excellent | Very Good | Good | Fair | Poor | Males | |
| Aged 15-49 |
29.0
|
96.2
|
96.8
|
94.5
|
82.6
|
43.1
|
| Aged 50-64 |
39.0
|
79.6
|
86.0
|
77.1
|
43.8
|
25.0
|
| Females |
|
|
|
|
|
|
| Aged 15-49 |
14.0
|
79.5
|
78.5
|
72.3
|
59.3
|
37.2
|
| Aged 50-60 |
21.0
|
74.2
|
75.5
|
60.0
|
37.1
|
8.9
|
* In labour force includes employed and unemployed.
Source: Cai and Kalb 2004, Table 1 and related text.
There is growing evidence that individuals with chronic diseases have difficulty in securing employment and are more likely to drop out of the labour force (Crotty et al, 2002). Analysis of three National Health Surveys derived the odds of non-participation in the labour force of mature aged people (44 to 60 years) with chronic illness or health risk factors as summarised in Table 2 (Jose et al, 2004). The odds ratios show for example that, among women, asthma sufferers are 1.26 times more likely not to be in the labour force than non-asthma sufferers. Among men, diabetes sufferers are 2.47 times more likely not to be in the labour force than men who do not have diabetes. The results for exercise are less clear and require further study. They may perhaps reflect the fact that working makes it more difficult for some to find the time to undertake moderate or vigorous exercise compared to those not in the labour force.
Table 2: Odds ratios for non-participation in the labour force by selected health variables based on pooled data from National Health Surveys (1989-90, 1995, 2001)*
| Variables | Women aged 44-60 years | Men aged 44-60 years |
|---|---|---|
| Hypertension |
1.30
|
1.25
|
| Asthma |
1.26
|
1.36
|
| Arthritis |
1.25
|
2.05
|
| Diabetes |
1.84
|
2.47
|
| Cancer |
1.47
|
1.09
|
| Anxiety |
1.07
|
3.75
|
| Never smoked |
1.00
|
1.00
|
| Current smoker |
1.28
|
2.02
|
| Ex-smoker |
0.82
|
1.23
|
| Underweight |
1.02
|
2.18
|
| Acceptable weight |
1.00
|
1.00
|
| Overweight |
1.17
|
0.99
|
| Obese |
1.30
|
1.25
|
| Low exercise |
0.95
|
0.71
|
| Moderate exercise |
1.00
|
1.00
|
| High exercise |
1.22
|
0.96
|
* All variables are statistically significant at 5 per cent level of significance.
Source: Jose, Ravindiran & Abello 2004, Table 1.
In addition to the link between health and labour force participation, good health raises incomes by contributing to productivity in a number of ways (Bloom and Canning, 2001). Healthy workers may have more physical and mental energy and also require fewer days off to cope with health issues. Longer, healthy life expectancy encourages investment in education and healthier children are better able to attend and engage in schooling, thereby improving the effectiveness of schooling. Longer life expectancy also encourages saving for retirement and hence capital accumulation. Finally, healthier populations require less health care, so resources can be devoted to other areas of the economy.
Those suppositions are generally supported empirically. Research in the European Union concludes that those in the workforce who have a chronic health problem face restrictions on the kind or amount of work they can undertake (Gannon and Nolan, 2004). A summary of the results is shown in Table 3. In addition, wages are typically significantly lower for workers with disabilities, which is indicative of lower productivity.2
Table 3: Chronic health problems and work restrictions of Irish people aged 15 to 64
| Restricts kind of work | Ristricts amount of work | |||||
|---|---|---|---|---|---|---|
| Type of conditions | Considerables | Some extent |
No | Considerably | Some extent |
No |
| % | % | % | % | % | % | |
| Chest or breathing |
20.0
|
22.9
|
57.1
|
18.3
|
19.3
|
62.4
|
| Diabetes |
16.7
|
20.1
|
63.1
|
16.2
|
23.0
|
60.7
|
| Heart, blood pressure/circulation |
42.2
|
20.2
|
37.6
|
40.6
|
21.4
|
37.8
|
| Mental, nervous or emot ional |
72.4
|
14.5
|
13.1
|
69.4
|
16.2
|
14.4
|
| Stomach, liver, kidney or digestive |
32.0
|
18.7
|
48.7
|
30.9
|
19.7
|
49.0
|
Source: Gannon and Nolan, 2004, Table 4.5.
Moreover people with chronic health problems also reported in a separate survey that their conditions hampered them in undertaking their daily activities (see Table 4 for a summary of the results).
Table 4: Impact of chronic illness on daily lives for people aged 15 to 64 in Living in Ireland Survey 2000
| Type of condition | Hampered in daily activities | ||
|---|---|---|---|
| Severely % |
Some extent % |
No % |
|
| Neoplasms (cancers) |
35.6
|
18.4
|
45.9
|
| Circulatory system disorders |
8.2
|
55.3
|
36.5
|
| Respiratory system |
6.5
|
32.3
|
61.2
|
| Musculoskeletal system |
23.7
|
61.6
|
14.7
|
| Depression |
9.0
|
68.7
|
22.3
|
Source: Gannon and Nolan, 2004, Table 4.12.
Time off due to illness may be particularly important since it reduces both the output of the individual and the productivity of entire workplaces due to the need to duplicate skills and knowledge so that others can fill the gap. Not surprisingly, those with long-term illnesses and disabilities are more likely to be absent from work due to illness and the length of absence is likely to be longer (Kidd, Sloane and Ferko, 2000).
Causes of ill health in Australia
Lifestyle-related and largely preventable non-communicable diseases are among the leading causes of burden of disease in Australia as measured by Disability Adjusted Life Years (DALYs).3 While age, genetic make-up and lifestyle are independent risk factors for chronic disease, they also interact resulting in a cumulative impact over the lifecourse.
Table 5 gives the percentage distribution of DALYs in 1996 among the main disease and injury groups for the entire population and for each of five age groups. However, as Table 5 implies, if we were able to slow or reverse the increased burden of these diseases as the population ages through cost-effective lifestyle changes there would be potential at least to slow the projected growth in health expenditure associated with them, while also improving labour force participation and productivity.
Table 5: Burden of disease by age group and health expenditure
| Disease category | Per cent of total DALYs 1996 | Total health expenditure 2000-01 $ million |
|||||
|---|---|---|---|---|---|---|---|
| Persons | 0-14 | 15-34 | 35-54 | 55-74 | 75+ | ||
| Neoplasms (cancers) |
19.4
|
2.5
|
4.1
|
20.5
|
30.9
|
19.2
|
2,764
|
| Cardiovascular disease |
21.0
|
1.1
|
2.4
|
13.1
|
27.7
|
41.1
|
5,393
|
| Mental disorders |
13.2
|
15.9
|
44.4
|
19.5
|
2.8
|
0.4
|
3,018
|
| Nervous system disorders including Alzheimer’s and other dementias |
9.4
|
4.3
|
2.8
|
4.0
|
10.8
|
18.1
|
4,858
|
| Chronic respiratory disease |
7.1
|
20.2
|
4.6
|
5.1
|
7.0
|
6.0
|
3,533
|
| Musculoskeletal disease |
3.6
|
1.1
|
2.2
|
6.3
|
4.8
|
1.6
|
4,725
|
| Diabetes* |
3.0
|
1.0
|
1.0
|
5.1
|
3.6
|
2.4
|
836
|
| Digestive system diseases |
2.6
|
0.9
|
2.2
|
3.4
|
2.7
|
2.5
|
2,821
|
| Genitourinary diseases |
2.5
|
0.2
|
3.5
|
2.5
|
2.5
|
2.5
|
2,081
|
| Injuries |
8.4
|
11.2
|
23.5
|
11.7
|
3.0
|
1.9
|
4,061
|
| All other diseases |
9.8
|
41.6
|
9.3
|
8.8
|
4.2
|
4.3
|
15084
|
| Total |
100.0
|
100.0
|
100.0
|
100.0
|
100.0
|
100.0
|
49,174
|
*
Includes both Type 1 and Type 2 diabetes of which the latter accounts for 85-90 per cent of all diabetes cases in Australia.
Sources: Derived from data in Mathers et al, 1999 and AIHW, 2004.
Risk factors for lifestyle-related chronic disease
The onset, maintenance and prognosis of chronic diseases are influenced by:
- behavioural risk factors (in particular smoking, poor nutrition, high-risk alcohol use and physical inactivity);
- biomedical risk factors (impaired glucose metabolism, high blood pressure, high blood cholesterol, excess weight); and
- broad influences (age, genetics, psycho-social and environmental factors).
- noted these risk factors tend to coexist and interact in their effect. A number of behavioural and biomedical risk factors are avoidable and modifiable. There is therefore potential for health gains to be achieved from early intervention or appropriate management. These risk factors can be identified and managed for individuals, however a broader population approach can be more cost-effective because the risk factors are widespread across the population and cumulative over an individual’s lifespan. The nature of these lifestyle-related chronic diseases underscores the added benefits of promoting good behaviours from an early age (Rose, 1992).
Risk factors such as smoking, physical inactivity, obesity, high blood pressure and high cholesterol are significant contributors to lifestyle-related chronic disease and are therefore responsible for a sizeable proportion of the total burden of disease in Australia as shown in Table 6. The WHO notes that through attention to improving diet and increasing exercise many of these chronic diseases would be largely preventable (WHO, 2004).
Table 6: Burden of disease attributable to 10 major risk factors — 1996
| % of total disability-adjusted life years (DALYs) | |||
|---|---|---|---|
| Risk factor | Males | Females | Persons |
| Tobacco |
12.1
|
6.8
|
9.7
|
| Physical inactivity |
6.0
|
7.5
|
6.7
|
| High blood pressure |
5.1
|
5.8
|
5.4
|
| Alcohol harm |
6.6
|
3.1
|
4.9
|
| Alcohol benefit |
-2.4
|
-3.2
|
-2.8
|
| Obesity |
4.3
|
4.3
|
4.3
|
| Lack of fruit and vegetables |
3.0
|
2.4
|
2.7
|
| High blood cholesterol level |
3.2
|
1.9
|
2.6
|
| Illicit drugs |
2.2
|
1.3
|
1.8
|
| Occupation |
2.4
|
1.0
|
1.7
|
| Unsafe sex |
1.1
|
0.7
|
0.9
|
Source: Mathers et al, 2000, Table 7.
Poor diet, physical inactivity and excess weight are common risk factors for non-communicable diseases such as coronary heart disease, stroke, colorectal cancer, Type 2 diabetes and osteoporosis. For example the relative risk of coronary heart disease associated with physical inactivity ranges from 1.5 to 2.4, an increase in risk comparable to that observed for high blood cholesterol, high blood pressure, or smoking (Pate et al, 1995). Diet and physical activity may also interact with other risk factors such as tobacco-smoking and depression, which themselves are significant causes of disease and death.45
Rose suggested that for many chronic illnesses a population strategy aimed at changing social attitudes would lower the mean level of risk factors and shift the whole distribution of exposure in a favourable direction. Such a strategy would be more cost-effective than treating those who go on to develop disease. This is because the strategy aims to remove or reduce the underlying causes that make the disease common and therefore expensive to treat. As Rose notes:
‘Once a social norm of behaviour has become accepted and (as in the case of diet) once the supply industries have adapted themselves to the new pattern, then the maintenance of that situation no longer requires effort from individuals. The health education phase aimed at changing individuals is, we hope, a temporary necessity, pending changes in the norms of what is socially acceptable.’ (Rose, 1985)
A clear example of this is the decline in the number of smokers and the change in the social acceptability of smoking, as a result of the wide dissemination of the results of research as to the health implications of smoking and living and working in an environment polluted by tobacco smoke.
Another well-documented case is that of North Karelia in Finland where from 1972 a concerted effort was made to change the high-fat diet of the population. Dietary habits were deeply rooted in the community through its cultural, agricultural and economic features, so the strategy involved media campaigns, collaboration with the food industry and agricultural reforms. After a five-year pilot programme in North Karelia the programme was extended throughout Finland.
Some 25 years after the programme’s inception there were significant changes in dietary habits and serum cholesterol levels in North Karelia were reduced by 18percent. The age-adjusted coronary heart disease mortality declined by 73percent among 35 to 64year old men and all-cause mortality was reduced by 50percent in the working age population over the same period (Puska, 1999).
Type 2 diabetes case study
The rapid increase in Type 2 diabetes in Australia and other countries reflects the rising impact of the risk factors discussed above.
An individual’s risk of developing Type 2 diabetes increases as a result of ageing and genetic predisposition. However, behavioural risk factors including overweight and obesity, physical inactivity and poor nutrition also contribute to the development of the disease.
The 1999-00 Australian Diabetes, Obesity and Lifestyle Study estimated that 7percent of Australians aged 25 and over (around 900,000 people) had Type 2 diabetes, and only 50percent of those who tested positive knew they had the condition (Dunstan et al, 2002). The incidence of Type 2 diabetes in the Indigenous population is significantly higher (see Box 1).
One in four Australians over the age of 25 years has impaired glucose metabolism, either impaired fasting glucose (IFG) or impaired glucose tolerance (IGT). Both IFG and IGT are known precursors to developing Type 2 diabetes and it is estimated that people with IFG or IGT usually convert to Type 2 diabetes at a rate of 5 to 10percent per year (Medicine Australia). Harris and Zimmet (1992) found that although many people with IGT may revert to normal glucose tolerance, one in three is likely to develop Type2 diabetes within 10 years. A s
eparate study that describes the incidence of different stages of glucose tolerance in a population from Mauritius found that of those known to have IFG in 1987, 38 per cent developed diabetes after 11 years. The corresponding figure for IGT was 46 per cent (Soderberg et al, 2004).
Growth in prevalence of diabetes
Before the 1999-00 Australian Diabetes, Obesity and Lifestyle Study there had only been two previous population-based studies of diabetes prevalence based on the oral glucose tolerance test. A 1981 study from Busselton, WA, showed a prevalence of 3.4percent (2.5 per cent known cases and 0.9 per cent newly diagnosed) in subjects aged 25years or more. Diabetes prevalence has more than doubled since 1981, and this is only partially explained by changes in age profile and obesity (Dunstan et al 2002).
The International Diabetes Federation estimated that the number of people with diabetes worldwide for 2003 was 194 million and forecasts that this will increase to 334million by 2025. The resulting prevalence of people aged 20 to 79 with diabetes is expected to increase from 5.1 per cent to 6.3 per cent (International Diabetes Foundation, 2003).
|
Box 1: Prevalence of Type 2 diabetes in the Indigenous populations The prevalence of Type 2 diabetes is considerably higher among Aboriginal and Torres Strait Islander peoples than for the whole of the Australian population. In the 2001 Indigenous supplement to the National Health Survey, diabetes was reported by 5 per cent of the Indigenous population. After adjusting for age, Indigenous Australians were more than three times as likely as the non Indigenous population to have diabetes (11 per cent compared with 3 per cent). Indigenous people living in remote areas had a significantly higher rate of diabetes than those living in non remote areas (16 per cent compared to 9 per cent) (ABS Cat. No. 4715.0, 2001). Studies suggest that the prevalence may be as high as 30percent in some Aboriginal communities (de Courten et al 1998). Based on self reported information obtained in 2001, 20 per cent of Indigenous Australians aged 45 to 54 years and 29 per cent aged 55 and over had diabetes. On the basis that diabetes is likely to be undiagnosed in 50 per cent of those with the disease, Indigenous Australians aged 55 and over are more likely to have diabetes than not. Moreover diabetes has a far greater impact on mortality of the Indigenous population. Over the period 1999 to 2001 diabetes was responsible for 8.5 per cent of total Indigenous deaths compared to 2.3 per cent of total Australian deaths (ABS Cat. No. 4704.0, 2003). |
Complications of Type 2 diabetes
While Type 2 diabetes can be debilitating in itself, it can lead to other significant health complications such as coronary heart disease, stroke and kidney disease, nerve damage, foot ulcers, blindness and amputations, for which the risks often increase with the duration of diabetes. The longer Type 2 diabetes progresses unrecognised and untreated the more likely sufferers will develop one or more of these related, more serious health complications. There is some concern for example that the significant reductions in coronary heart disease achieved in Australia through the sustained anti-smoking campaign may be unwound due to the increasing incidence of Type 2 diabetes.
As noted in Table 5 above, Type 2 diabetes is one of the ten leading causes of burden of disease and injury in Australia. It was implicated in over 8percent of all deaths in Australia in 2002 (AIHW 2005). Moreover the odds ratios for non-participation in the labour force for men and women aged 44 to 60 years with diabetes are 2.47 and 1.84 to one respectively (see Table 2).
Because diabetes can lead to other health complications, its proper management may involve a complex mix of changes in lifestyle, medications and involvement of a range of health professionals, including diabetes educators, GPs, endocrinologists, podiatrists, ophthalmologists and optometrists, kidney specialists and dieticians. It is therefore a relatively expensive disease to manage and accounted directly for around $784million or 1.7percent of total allocatable recurrent government health expenditure in 2000-01 (see Table 7).
Table 7: Direct health expenditure on diabetes, by age group, 2000-01 ($millions)
| Sector | 0-4 | 5-14 | 15-24 | 25-34 | 35-44 | 45-54 | 55-64 | 65-74 | 75+ | All ages |
|---|---|---|---|---|---|---|---|---|---|---|
| Admitted hospital patients* |
1.0
|
4.8
|
6.0
|
6.6
|
12.2
|
24.9
|
40.3
|
60.9
|
74.2
|
230.9
|
| Non-admitted hospital patients |
0.0
|
1.9
|
0.0
|
0.0
|
0.0
|
2.6
|
23.5
|
16.9
|
13.2
|
58.0
|
| Total hospital |
1.0
|
6.7
|
6.0
|
6.6
|
12.2
|
27.5
|
63.8
|
77.8
|
87.4
|
289.0
|
| Out-of-hospital medical services |
0.3
|
0.6
|
1.9
|
5.1
|
13.4
|
34.5
|
39.8
|
51.0
|
36.3
|
182.8
|
| Other professional services |
0.0
|
0.0
|
0.4
|
0.1
|
3.6
|
3.4
|
8.5
|
8.8
|
11.1
|
35.9
|
| Pharmaceuticals |
0.6
|
2.2
|
5.0
|
8.8
|
16.3
|
30.0
|
45.0
|
57.4
|
38.4
|
203.6
|
| Aged care homes |
0.0
|
0.0
|
0.0
|
0.0
|
0.0
|
2.5
|
2.8
|
3.5
|
28.8
|
37.7
|
| Research |
0.1
|
0.5
|
0.6
|
0.9
|
2.1
|
4.7
|
7.6
|
9.2
|
9.1
|
34.6
|
| Total expenditure |
2.0
|
10.0
|
13.9
|
21.5
|
47.5
|
102.5
|
167.7
|
207.6
|
211.0
|
783.6
|
* Includes an estimate of in-hospital private medical services.
Source: AIHW Disease Expenditure Data Base reported in AIHW Bulletin 26, April 2005, Costs of Diabetes in Australia, 2000-01, Table 1.
Treatment for complications of diabetes may incur substantial costs that are not fully accounted for in this estimate. For example dialysis for end-stage renal disease, the most common cause of which is diabetes, may incur hospital costs of an average $67,000 per person treated over one year. When complications and associated diseases are accounted for, the total health system expenditure attributed to diabetes increases significantly.
A 2002 national study of the burden of Type 2 diabetes estimated that when the associated complications were taken into account the average annual health cost per person was $5,360 plus $5,540 in benefits such as pensions and sickness benefits, yielding a total cost per annum of $3 billion (Australian Diabetes Society, 2002). The health cost per person increases with the onset of complications (see Table 8). The subjects in the study were predominantly elderly with a mean age of 65 years and relatively few were employed. This would have imposed a significant upward bias in the Government subsidies, but they nevertheless increased for those who develop associated complications.
Table 8: Costs per person with diabetes
| Cost | Complications | ||||
|---|---|---|---|---|---|
| Overall | None | Microvascular | Macrovascular | Both | |
| Health costs | $ | $ | $ | $ | $ |
| Direct |
5,325
|
3,990
|
6,990
|
8,985
|
9,610
|
| Indirect |
35
|
35
|
35
|
70
|
35
|
| Total |
5,350
|
4,025
|
7,025
|
9,055
|
9,645
|
| Government subsidies |
5,540
|
5,075
|
6,200
|
6,120
|
6,240
|
Source: Australian Diabetes Society, 2002, Table 5.
Health promotion, lifestyle modification strategies for delaying and possibly preventing diabetes
Overweight and obesity and lack of physical activity significantly increase the likelihood of developing Type 2 diabetes. Overweight adults are three times more likely and obese adults possibly 10 times more likely to develop the disease. In 2001, 77.1percent of people aged over 15 years with diabetes were inactive compared with 68.2percent of those without diabetes. Some 54.9percent of diabetics were overweight or obese and sedentary compared with 33.6percent of non-diabetics (National Centre for Monitoring Diabetes, 2002).
Theory as espoused by Rose (1992) and clinical trials suggest that strategies aimed at reducing weight and increasing physical activity across the general population would be effective in minimising a person’s risk of developing Type 2 diabetes.
For example, in the US, the Diabetes Prevention Programme (2002) undertook a trial involving 3,234 overweight people with impaired glucose tolerance (a pre-diabetic condition), a mean age of 51 years and a mean body mass index (BMI) of 34.0.6
The participants were randomly assigned to one of three groups. The first group undertook an intensive lifestyle modification programme involving lowered intake of fat and calories with the goal of at least a 7percent weight loss and to exercise at moderate intensity (usually by walking an average 30 minutes a day) on five days a week. The intervention involved 16 one-on-one culturally sensitive and individualized lessons covering diet, exercise and behaviour modification designed to achieve a modest and maintained 5 to 7percent weight loss. The second group took metformin (Glucophage) and was given standard lifestyle recommendations. The third group was given a placebo and standard lifestyle recommendations. The participants were followed up on average after 2.8 years (range 1.8 to 4.6 years).
The incidence of Type 2 diabetes per 100 was 4.8 cases for Group 1, 7.8 cases for Group2 and 11 for Group 3. Thus compared with the control group the intensive lifestyle intervention reduced the incidence of Type 2 diabetes by 58percent (95percent confidence interval, 48-66percent). The metformin group members reduced their incidence of Type 2 diabetes by 31percent (95percent confidence interval 17-43percent).
Participants assigned to Group 1 had much greater weight loss and a greater increase in leisure physical activity than did the other participants. Fiftypercent had achieved the weight loss goal of at least 7percent at 24 weeks, but that had reduced to 38percent at the latest visit. The average weight loss was 5.6 kg, 2.1 kg and 0.1 kg for Groups 1 to 3 respectively. At 24 weeks, 74percent of Group 1 participants were physically active for at least 150 minutes per week, reducing to 58percent at the last visit. However those in Group 1 increased their physical activity much more that those in the other groups.
On the basis of these results the estimated number of people who would need to be treated for three years to prevent one case of diabetes is 7 using the intensive lifestyle intervention and 14 using the metformin. Relative to the placebo intervention, the in-trial costs for each case of diabetes prevented in the US study was US$15,700 for lifestyle intervention and US$31,300 for metformin. 7 Costs per QALY (quality adjusted life-year) gained was US$31,500 and US$99,600 for the lifestyle and metformin interventions respectively. Thus the US data suggests that intensive lifestyle intervention was approximately two to three times as cost-effective as the metformin intervention.
Similar results have been observed in comparable studies undertaken in Sweden, China and Finland. 8
In the Finnish study there were two groups - those that were given an intensive lifestyle intervention and the control group which received only general health advice. Participants in both groups were
ranked according to their success in achieving the goals of the intensive intervention. The success rates after one year for each goal are shown in Table9.
Table 9: Success in achieving the goals of intervention after one year
| Goal | Intervention Group | Control Group |
|---|---|---|
| % of subjects | ||
| Weight reduction > 5% |
43
|
13
|
| Fat intake < 30% of energy intake |
47
|
26
|
| Saturated fat intake < 10% of energy intake |
26
|
11
|
| Fibre intake ≥15g/1000kcal |
25
|
12
|
| Exercise >4hr/week |
86
|
71
|
Source: Tuomilehto et al, 2001, Table 4.
There was a strong inverse correlation between the success score and the incidence of Type 2 diabetes. Thirteen subjects in the intervention group and 48 in the control group did not achieve any of the goals; diabetes developed in 38 and 31percent of these subjects respectively over the duration of the study. On the other hand diabetes had not developed in any of the subjects who reached four or five of the goals (49 in the intervention group and 15 in the control group). As-yet-unpublished data following the intervention and control groups over ten years indicates that while the cumulative probability of remaining free of Type 2 diabetes declined steadily in both groups, the rate of decline was slower in the intervention group. At the end of ten years the probability of a member of the intervention group remaining free of diabetes was around 65 per cent compared with around 45 per cent for the control group (Tuomilehto 2004).
More intensive interventions to reduce weight and increase physical activity for people at high risk of developing Type 2 diabetes would clearly also have secondary benefits, through reducing their risk of developing other diseases associated with overweight and a sedentary lifestyle.
Overweight and obesity
Studies of overweight and obese employees have shown that obese employees take more sick leave than non-obese employees and are twice as likely to have high-level absenteeism (seven or more health-related absences during the last six months) (Burton et al, 1998 and Tucker et al, 1998).
Overweight and obesity are believed to be associated with many chronic disorders (see Table 10). In the US, research has shown that obesity may account for as much as a 36percent increase in costs for inpatient and ambulatory care for individuals, which is a greater increase than that attributed to ageing 20 years, smoking or problem drinking (Heithoff et al, 1997).
Table 10: Overweight and obesity raise the risk for:
| Type 2 diabetes | Poor female reproductive health |
| High blood pressure |
|
| High cholesterol levels |
|
| Coronary heart disease |
|
| Congestive heart failure |
|
| Angina pectoris | Cancers of the |
| Stroke |
|
| Asthma |
|
| Osteoarthritis |
|
| Musculoskeletal disorders |
|
| Gall bladder disease |
|
| Sleep apnea and respiratory problems |
|
| Gout |
|
| Bladder control problems |
|
Source: United States Department of Health and Human Services, Prevention Makes Common ‘Cents’, September 2003, page 5.
Overweight, and in particular obesity, are acknowledged to be at epidemic levels worldwide, with Australia being one of the worst affected nations. The 2001 Australian Bureau of Statistics (ABS) National Health Survey (NHS), showed that more than 7million Australian adults (aged 18 years and over) were overweight (based on self-reported data) (Dixon and Waters 2003). The combined rate of overweight and obesity is 67 per cent for men aged 25 to 64 years and 52 per cent for women in the same age group.
There have been significant increases over the past 15 years in the proportions of overweight and obese Australians (see Table 11 and Figures 2 and 3).
Table 11: Prevalence of overweight and obesity(a) among men and women aged 25-64 years(b), 1980 to 1999-2000, measured in various surveys
| Sex | Year | Overweight but not obese |
Obese | Overweight |
|---|---|---|---|---|
| Per cent (c) | ||||
| Men | 1980 (RFPS) (d) |
37.9
|
9.4
|
47.4
|
| 1983 (RFPS) (d) |
40.4
|
8.9
|
49.3
|
|
| 1989 (RFPS) (d) |
43.0
|
10.4
|
53.4
|
|
| 1995 (ABS:NNS) |
48.7
|
19.6
|
68.2
|
|
| 1999-2000 (AusDiab) |
48.8
|
16.9
|
65.7
|
|
| Women | 1980 (RFPS) (d) |
19.3
|
7.9
|
27.2
|
| 1983 (RFPS) (d) |
21.8
|
10.4
|
32.2
|
|
| 1989 (RFPS) (d) |
24.5
|
12.5
|
36.9
|
|
| 1995 (ABS:NNS) |
30.1
|
19.2
|
49.3
|
|
| 1999-2000 (AusDiab) |
26.7
|
19.8
|
46.5
|
|
(a) Based on measured height and weight.
(b) Living in capital cities and urban areas only.
(c) Age-standardised to the 2001 Australian population.
(d) Risk Factor Prevalence Survey conducted by National Heart Foundation.
Sources: NHF 1980, 1983 and 1989 Risk Factor Prevalence Surveys; ABS 1995 National Nutrition Survey; 1999-2000 Australian Diabetes, Obesity and Lifestyle Study (AusDiab); Reported in AIHW 2003. Indicators o
f health risk factors: the AIHW view. AIHW Cat.No. PHE 47, Canberra.
Figure 2: Average weight (self-reported) across the adult life span,
1989 to 2001
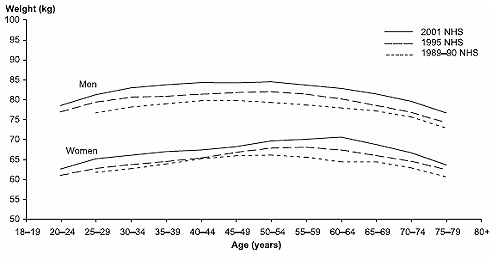
Source: AIHW analysis of the 1989-90, 1995 and 2001 National Health Surveys.
Published in: Bennett, SA et al 2004.
Figure 3: Trends in weight (measured) by age cohort,
1980 to 2000

Sources: AIHW analysis of the 1980 Risk Factor Prevalence Survey; 1999-2000 Australian Diabetes, Obesity and Lifestyle Study (AusDiab).
Published in: Bennett SA et al 2004.
The rates of childhood overweight or obesity in Australia have increased from around 5per cent in the 1960s to around 25 per cent today. In 1995 compared with other developed countries there was a relatively high percentage (21 per cent) of Australian children who were considered overweight or obese. Childhood obesity in Australia has been estimated to be rising at an annual rate of 1 per cent, meaning that half of all young Australians could be overweight by the year 2025 (Australasian Society for the Study of Obesity 2004). Research also shows that people who are overweight or obese as children are likely to be overweight as adults.
Unless we can slow, halt, or ideally reverse the current trend, we will have a much larger percentage of working-age and elderly people who are overweight or obese in future, with an associated decrease in labour force participation and an increase in health expenditure, particularly for those who go on to develop associated chronic illnesses. Moreover a more overweight and obese elderly population will place an additional physical burden on aged carers and health workers, potentially leading to more work-related injury.
Physical Inactivity
The Australian Institute of Health and Welfare (1999) reported that:
‘There is strong epidemiological evidence that physical inactivity is causally associated with increased risk of mortality and incidence for a number of diseases and injury. Physical activity reduces the risk of coronary heart disease. People who do not participate in regular physical activity are almost twice as likely to die from coronary heart disease as those who participate. The evidence also suggests that physical activity may also play a protective role against stroke as leisure-time physical activity and vigorous work-related physical activity have been shown to lower the incidence of stroke.
Insufficient physical activity tends to occur with other risk factors for cardiovascular disease such as obesity, high blood pressure, high blood cholesterol and HDL cholesterol. There is also evidence that people who increase their level of physical activity will reduce their levels of these risk factors.’
Table 12 provides a measure of the increase in risk of disease and injury associated with reduced physical activity, compared with those who undertake vigorous exercise.
Table 12: Relative risks for disease and injuries associated with physical inactivity
| Relative risk at ages under 65 | Relative risk at ages 65 and over | |||||||
|---|---|---|---|---|---|---|---|---|
| Cause | Sedentary | Low | Moderate | Vigorous | Sedentary | Low | Moderate | Vigorous |
| Colorectal cancer |
1.70
|
1.70
|
1.21
|
1.00
|
1.70
|
1.70
|
1.21
|
1.00
|
| Breast cancer |
1.40
|
1.40
|
1.27
|
1.00
|
1.00
|
|||
| Hypertension |
1.50
|
1.50
|
1.00
|
1.00
|
1.25
|
1.25
|
1.00
|
1.00
|
| Ischaemic heart disease - mortality |
1.90
|
1.50
|
1.36
|
1.00
|
1.45
|
1.25
|
1.18
|
1.00
|
| Ischaemic heart disease - incidence |
1.50
|
1.50
|
1.00
|
1.00
|
1.25
|
1.25
|
1.00
|
1.00
|
| Stroke |
2.00
|
2.00
|
1.00
|
1.00
|
1.50
|
1.50
|
1.00
|
1.00
|
| Type 2 diabetes |
1.30
|
1.30
|
1.00
|
1.00
|
1.15
|
1.15
|
1.00
|
1.00
|
| Falls |
2.50
|
2.50
|
1.79
|
1.00
|
2.50
|
2.50
|
1.79
|
1.00
|
| Depression |
1.30
|
1.30
|
1.00
|
1.00
|
1.30
|
1.30
|
1.00
|
1.00
|
Source: Australian Institute of Health and Welfare, 1999, Table 7.16.
As reported by the US Department of Health and Human Services (2002) researchers at the US Center for Disease Control and Prevention found that physically active people had, on average, lower annual direct medical costs than did inactive people. Moreover they found that
‘physically active people had fewer hospital stays and physician visits and used less medication than physically inactive people. The cost savings were consistent for men and women and even for smokers and non-smokers.’
Additional research also concluded that ‘workplace physical activity programmes can reduce short-term sick leave by 6 to 32percent and increase productivity by 2 to 52percent’.
Conclusion
In Austral
ia common and preventable risk factors, primarily tobacco-smoking, risky alcohol use, poor diet, overweight and insufficient exercise play a large part in lowering labour force participation and productivity and are principal causes of chronic non-communicable disease leading to high morbidity, mortality and significant health care costs.
National and international evidence increasingly shows that health promotion activities can be highly cost-effective in improving lifestyles and reducing the risks of developing chronic diseases such as Type 2 diabetes. Further, the Type 2 diabetes case studies and the theory espoused by Rose (1992) and endorsed by the WHO (2004) suggest that success in encouraging greater physical activity and reversing population weight gain is maximised through intensive and consistent strategies applied across the entire population.
Australia has recently begun to put in place a wide range of national disease prevention strategies. For example the strategic focus of Be Active Australia: A framework for health sector action for physical activity 2005-2010 is on building public policy and creating supportive environments that enhance the capacity of individuals and communities for physical activity. In raising the profile of physical activity as a major health problem, action will be taken to improve the capacity of the health sector to respond to community needs and contribute to sustainable health improvements. The Eat Well Australia: An agenda for action in public health nutrition 2000-2010 is a national approach for the prevention and management of diet-related disease and the Prime Minister’s 2004 Building a Healthy, Active Australia initiative establishes an after-school physical activity programme for about 150,000 children.
In November 2002 Australian Health Ministers agreed that the problem of overweight, obesity and a sedentary lifestyle required an Australia-wide response and they established the National Obesity Taskforce (see Annex) to:
- develop a national action plan for tacking overweight and obesity which encompasses both immediate investments as well as longer term investments, drawing on existing strategies and structures and developing new approaches where necessary;
- develop and agree on roles and responsibilities for implementing a range of initiatives;
- lead communication within sectors and jurisdictions about implementation of the action plan; and
- bring forward proposals on how the obesity and health weight agenda might continue to be developed beyond the life of the Taskforce (Healthy Weight 2008).
Central to the success of these objectives will be the sustained and coordinated commitment of resources to plan, implement and pursue agreed strategies over many years. The Australian and state and territory governments have an interest in funding the strategy, given the long-term benefits of a healthier population in terms of labour force participation, productivity and health outlays.
Businesses also have an interest as they will benefit from the improved participation and productivity associated with a healthier workforce. Many will also need to adapt to changes in demand that are likely to flow from a successful change in population lifestyles. Accordingly the National Obesity Taskforce has established a Consultative Forum (see Annex) to provide a cross-sectoral perspective and to build on collaboration with other sectors that have a role to play in reducing overweight and obesity and increasing physical activity.
In this way Australia might look forward to reducing the rising incidence of overweight and obesity and physical inactivity that are contributing to the growing burden of Type 2 diabetes and other lifestyle-related chronic diseases. A focus on health promotion that leads to an overall healthier population will increase labour force participation rates and labour productivity, thereby improving the wellbeing of Australians and putting health care expenditure on a more sustainable path as the population ages.
Ideally, over time healthy eating and exercise will become the socially accepted norm in much the same way as not smoking is now regarded as the social norm in Australia.
References
Australasian Society for the Study of Obesity, 2004 Obesity in Australian Children.
Australian Bureau of Statistics (ABS) 2001, Cat. No. 4715.0, National Health Survey: Aboriginal and Torres Strait Islander Results, Australia, 2001.
Australian Bureau of Statistics (ABS) 2003, Cat. No. 4704.0, The Health and Welfare of Australia’s Aboriginal and Torres Strait Islander Peoples Australia, 2003.
Australian Diabetes Society, 2002, DiabCost Australia: Assessing the Burden of Type 2 Diabetes in Australia — Australian Diabetes Educators Association Annual Scientific Meeting, 26 September 2002, Adelaide.
Australian Institute of Health and Welfare (AIHW) 1999, The Burden of Disease and Injury in Australia, November 1999, pp. 124-6.
Australian Institute of Health and Welfare (AIHW) 2002, Diabetes: Australian Facts 2002, AIHW Cat. No. CVD 20, Canberra.
Australian Institute of Health and Welfare (AIHW) 2004, Australia’s Health 2004, Canberra.
Australian Institute of Health and Welfare (AIHW) 2004, Health system expenditure on disease and injury in Australia, 2000-01, Health and Welfare Expenditure Series No. 19, May 2004.
Australian Institute of Health and Welfare (AIHW) 2005, Costs of Diabetes in Australia, 2000-01, AIHW Bulletin 26 April 2005
Bennett SA, Magnus P and Gibson D 2004, Obesity trends in older Australians, AIHW Bulletin No. 12, Cat. No. AUS 42, Canberra.
Berkowitz M and Johnson W 1974, ‘Health and labor force participation’, Journal of Human Resources Vol. 9 No. 1, pp. 117-28.
Bloom D and Canning D 2001, ‘The effect of health on economic growth: Theory and evidence’, NBER working paper No. 8587.
Bound J, Schoenbaum M, Stinebrickner T and Waidmann T 1998, ‘The dynamic effects of health on the labor force transitions of older workers’, NBER working paper No.6777.
Burton WN, et al 1998, ‘The economic costs associated with body mass index in a workplace’, Journal of Occupational and Environmental Medicine 1998, Sep 40(9) pp.786-792, reported in Prevention Makes Common ‘Cents’, US Department of Health and Human Services, September 2003.
Cai L and Kalb G 2004, ‘Health Status and Labour Force Participation: Evidence from the HILDA Data’, Melbourne Institute Working Paper No. 4/04.
Chan S and Stevens A 1999, ‘Employment and retirement following a late-career job loss’, American Economic Review Vol. 89 No. 2, pp. 211-6.
Crotty M, Giles LC, Cameron ID and Brooks PM 2002, ‘Musculoskeletal disability, chronic disease and labour force participation in Australia’, International Journal of Disability, Community & Rehabilitation, Vol. 03.
de Courten M et al 1998, Review of the Epidemiology, Aetiology, Pathogenesis and Preventability of Diabetes in Aboriginal and Torres Strait Islander Populations, Office of Aboriginal and Torres Strait Islander Health, Commonwealth Department of Health and Family Services, Canberra.
Diabetes Prevention Programme Research Group, 2002, ‘Reduction in the incidence of type 2 diabetes with lifestyle intervention or metformin’, New England Journal of Medicine 2002, pp. 393-403, reported in Medicine Australia, Landmark studies in diabetes prevention at
www.medicineau.net.au, accessed on 13 July 2005.
Dixon T and Waters AM 2003, ‘A growing problem: trends and patterns in over
weight and obesity among Australian adults, 1980-2001’, AIHW Bulletin, No. 8 Cat.No. AUS 36, Canberra.
Dunstan D, Zimmet P, Welborn T, de Courten M, Cameron A, Sicree R et al 2002, ‘The rising prevalence of diabetes and impaired glucose intolerance: the Australian diabetes, obesity and lifestyle study’, Diabetes Care, 25, pp. 829-34.
Eriksson KF and Lindgarde F 1991, ‘Prevention of type 2 (non-insulin dependent) diabetes mellitus by diet and physical exercise: the 6-year Malmo feasibility study’, Diabetologia, 34(12), pp. 891-898.
Harris MI and Zimmet PZ 1992, ‘Classification of diabetes mellitus and other categories of glucose intolerance, in Keen H et al (eds), The international textbook of diabetes mellitus, London, John Wiley, pp. 3-18, Reported in AIHW 2002.
Gannon B and Nolan B 2004, Disability and Labour Market Participation, The Economic and Social Research Institute.
Grady R and Hayward M 1986, ‘The occupational retention and recruitment of older men: the influence of structural characteristics of work’, Social Forces, Vol. 64 No. 3.
Healthy Weight 2008, Australia’s Future, The National Action Agenda for Children and Young People and their Families, Commonwealth of Australia, 2003.
Heithoff KA, Cuffel BJ, Kennedy S, Peters J 1997, ‘The association between body mass and health care expenditures’, Clinical Therapy, Jul-Aug 19(4) pp. 811-820, reported in Prevention Makes Common ‘Cents’, US Department of Health and Human Services, Sep 2003.
International Diabetes Federation 2003, Diabetes Atlas, 2nd Edition, Belgium.
Jose A, Ravindiran R and Abello R 2004, ‘Health status labour force non-participation nexus: Evidence from pooled NHS data.’ Paper prepared for the 12th Biennial Conference of the Australian Population Association, 15-17 September, Canberra.
Kidd M, Sloane P and Ferko I 2000, ‘Disability and the labour market: an analysis of British males’, Journal of Health Economics, Vol. 19, Issue 6, pp. 961-81.
Landers DM 1997, ‘The Influence of Exercise on Mental Health’, Arizona State University, reported in President’s Council on Physical Fitness and Sports (PCPFS) Research Digest, Series 2, No. 12.
Mathers C, Vos T and Steveson C 1999, ‘The burden of disease and injury in Australia’, November 1999, AIHW, Canberra.
Mathers C, Vos T, Stevenson C and Begg S 2000, ‘The Australian Burden of Disease Study: measuring the loss of health from diseases, injuries and risk factors’, The Medical Journal of Australia, Vol. 172, 19 June 2000 as reported in ABS Year Book 2002, Health Special Article — Chronic diseases and risk factors.
McGarry K 2002 ‘Health and retirement: Do changes in health affect retirement expectations?’, NBER working paper No. 9317.
Medicine Australia, ‘Landmark studies in diabetes prevention’; available from
www.medicineau.net.au, accessed on 13 July 2005.
National Centre for Monitoring Diabetes, 2002, Diabetes: Australian Facts, November 2002.
Pan XR, Li GW, Hu YH et al 1997, ‘Effects of diet and exercise in preventing NIDDM in people with impaired glucose tolerance: the Da Qing IGT and Diabetes Study’, Diabetes Care, 20 pp. 537-44.
Pate RR et al 1995, ‘Physical Activity and Public Health’, JAMA 273 pp. 402-407, reported in Prevention Makes Common ‘Cents’, US Department of Health and Human Services, Sep 2003.
Puska P 1999, ‘The North Karelia Project: from community intervention to national activity in lowering cholesterol levels and CHD risk’, European Heart Journal Supplements (S).
Rose G 1985, ‘Sick individuals and sick populations’, International Journal of Epidemiology, 14, pp. 32-8.
Rose G 1992, The Strategy of Preventive Medicine, Oxford Medical publication, Oxford University Press.
Soderberg S et al 2004, ‘High incidence of type 2 diabetes and increasing conversion rates from impaired fasting glucose and impaired glucose tolerance to diabetes in Mauritius’, Journal of Internal Medicine, 256: pp. 1-37.
Tucker LA et al 1998, ‘Obesity and Absenteeism: an epidemiologic study of 10,825 employed adults’, American Journal of Health Promotion, 12(3) pp. 202-207, reported in Prevention Makes Common ‘Cents’, US Department of Health and Human Services, Sep2003.
Tuomilehto J et al 2001, ‘Prevention of Type 2 Diabetes Mellitus by Change in Lifestyle among Subjects with Impaired Glucose Tolerance’, The New England Journal of Medicine, Vol 344, No.18, 3 May 2001, pp. 1343-50.
Tuomilehto, J 2004, Unpublished data presented to the Department of Health and Ageing, 8 December 2004. Six year data was reported in New England Journal of Medicine 2001, 344, pp. 1343-50.
US Dept of Health and Human Services, 2002, ‘Physical Activity Fundamental to Preventing Disease’, 20 June 2002.
World Health Organisation 2004, Global strategy on diet, physical activity and health, Report by the Secretariat to 57th World Health Assembly, A57/9, 17 April.
Annex
National Obesity Taskforce (2003)
Membership comprises: Secretary, Australian Government Department of Health and Ageing (Chair), State Health Department representatives from NSW, Victoria and Tasmania, Chair of the National Public Health Partnership (from WA), Chair of the Strategic InterGovernmental Nutritional Alliance, Chair of the Strategic InterGovernmental forum on Physical Activity and Health; and a Scientific Adviser.
National Obesity Taskforce, Consultative Forum
Membership comprises representatives from: Australian Chronic Disease Prevention Alliance, Australian Consumers’ Association, Australian Council on Health, Physical Education and Recreation, Australian Council of State School Organisations/Parents and Citizens Association, Australian Association of National Advertisers, Australian Chamber of Commerce and Industry, Australian Divisions of General Practice, Australian Food and Grocery Council, Australian Medical Association, Australian Principals Association Professional Development Council, Australian Retailers Association, Commercial Television Australia, The Coalition on Food Advertising to Children, Early Childhood Australia, Fitness Australia, Horticulture Australia Limited, McDonald’s Association, National Aboriginal Community Controlled Health Organisations, Planning Institute of Australia , Public Health Association of Australia, Royal Australian College of General Practitioners, Standing Committee on Recreation and Sport, Scientific Reference Group, Food Security representative NSW Centre for Public Health Nutrition.
1 The author is from the Macroeconomic Policy Division of the Australian Treasury. The article draws on previous research and analysis undertaken by Ben Dolman of the division. The author acknowledges and thanks officers of the Strategic Planning Branch, Population Health Division, the Australian Government Department of Health and Ageing for their input and suggestions. The paper has also benefited from comments and suggestions from other Treasury officers including, in particular, Graeme Davis, David de Carvalho and Joseph Castellino. The views in this article are those of the author and not necessarily those of the Australian Treasury.
2 Some have argued that only a portion of this differential is able to be explained by differential productivity, sug
gesting discrimination against disabled workers.
3 Burden of disease is a measurement of the difference between current health status and the ideal of living into old age free of disease and disability. One DALY is equivalent to one lost year of ‘healthy’ life and is calculated as a combination of years of life lost due to premature mortality (YLL) and equivalent ‘healthy’ years of life lost due to disability (YLD). The total burden of disease and injury in Australia in 1996 was estimated to be 2.5million DALYs or137 DALYs lost per 1,000 population.
4 US studies show that people who exercise are less likely to smoke. Several studies have confirmed that if you are a smoker and find it difficult to quit, exercise can still be beneficial. In fact, smokers who are active may have a lower risk of heart disease than non-smokers who are sedentary.
5 For a literature review see Landers (1997).
6 Body mass index (BMI) is calculated as the ratio of an individual’s weight divided by their height squared. A BMI in the range 20-24.9kg/m2 is generally regarded as healthy, 25-29.9kg/m2 is overweight and 30+kg/m2 is obese.
7 The Diabetes Prevention Program Group. Within-Trial cost-effectiveness of lifestyle intervention or metformin for the primary prevention of type 2 diabetes. Diabetes Care 2003:26:9: pp. 2518-2523
8 For Sweden see Eriksson and Lindgarde, (1991). For China see Pan etal, (1997). For Finland see Tuomilehto etal, (2001).