Paper prepared for briefing to the Committee for Economic Development of Australia[*]
Introduction
I would like to acknowledge the Gadigal people of the Eora Nation who are the Traditional Custodians of the Land where we are meeting today. I would like to pay my respects to their Elders – past, present and emerging – and extend my respect to any Indigenous Australians who are with us today.
Thank you for the opportunity to speak about the recently released 2023 Intergenerational Report (IGR). I will talk briefly about the IGR’s findings and then make some observations 20 years on from the first IGR.
The importance of fiscal transparency and sustainability
The IGR has many uses but one clear purpose: to promote fiscal transparency and sustainability. This is set out in the Charter of Budget Honesty Act 1998 which requires the Report to assess the long-term sustainability of current Government policies over 40 years, including taking account of demographic change.
Fiscal sustainability matters as it:
- ensures sustained funding for the essential public services citizens rely on
- provides certainty for individuals and firms about the direction of fiscal policy, which supports confidence for decisions around employment, consumption and investment
- promotes macroeconomic stability and provides fiscal space to respond to future economic shocks.
And importantly it promotes a discussion about intergenerational equity.
The 2023 IGR draws our attention to five powerful forces underway: population ageing, an associated demand for care and support services, technological transformation, climate change and geopolitical fragmentation.
These forces and how governments respond to and shape them will have significant implications for the prosperity of future generations.
IGR illustrative – but critical for transparency
Modelling what Australia will look like in 40 years can only ever be illustrative. Even the most sophisticated methodology relies on past data and must assume that future events play out in ways consistent with the relationships and dynamics of the past. Projections must make assumptions about things that are inherently unforecastable such as the long‑term exchange rate, terms of trade and technological progress.
The IGR, by design, reflects the policy commitments of the day. This means the IGR is not a prediction of the future per se. Rather, it demonstrates the longer term implications of our current path. Our aim is to avoid the risks projected by the IGR through ongoing improvement and reform of policy settings.
2023 IGR summary of results
As has been the case for all IGRs, the economy is projected to grow and living standards rise, but more slowly than in the past. By 2062‑63, the real economy is projected to be around two and a half times larger. Real gross national income per person is projected to be around 50 per cent higher.
However, real GDP is projected to grow by an average of 2.2 per cent per year over the next 40 years compared to 3.1 per cent over the past 40 years. The lower growth reflects slower productivity and population growth, and reduced participation due to ageing.
Projected slower productivity, population growth and lower participation is not unique to Australia. These outcomes are anticipated for most developed countries.[1]
Productivity
In the 2023 IGR we lowered our assumption for productivity growth from 1.5 per cent to 1.2 per cent reflecting the slowdown in productivity experienced over the past two decades (Chart 1). This also reflects an updated assessment of global productivity trends.
This has significant fiscal and broader policy implications, something I explore later in more detail when I look at IGRs over the past 20 years.
Chart 1: Australia's labour productivity growth
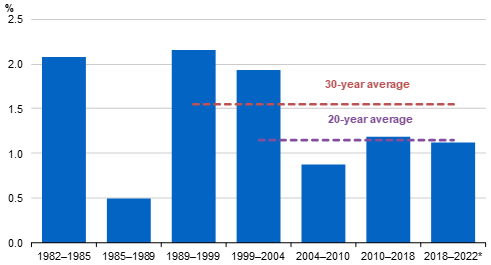
Note: Productivity cycles determined by the ABS. 2018-2022 is not a complete productivity cycle. The dashed lines represent 20‑year and 30-year labour productivity growth averages to 2021-22.
Source: Treasury analysis of ABS 2022 Australian System of National Accounts.
Population
Average annual population growth is projected to fall to 1.1 per cent per year over the next 40 years, compared to 1.4 per cent over the past 40 years (Chart 2).
We are projected to reach a population of 40.5 million by 2062–63.
Chart 2: Population growth
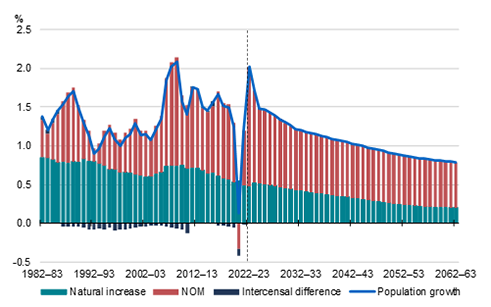
Source: Australian Bureau of Statistics (ABS), National State and territory population, September 2022, 2023; and Treasury
Australia’s population growth will continue to be supported by overseas migration and natural increase, but both are expected to fall relative to the size of the population.
There is sometimes a perception that the ageing of population is a temporary phenomenon particularly as the baby boomers age. However, this is not the case.
So long as the fertility rate is below replacement, successive generations will be smaller. Combine this with Australians living longer lives and the share of Australians aged 65 and over will just keep rising, albeit more slowly over time (Chart 3).
The share of the population aged 65 and over is projected to increase by 6.1 percentage points by 2062–63, to 23.4 per cent, while the share aged 85 and over increases by 2.9 percentage points to 5.0 per cent.
Chart 3: Share of population aged 65 and over
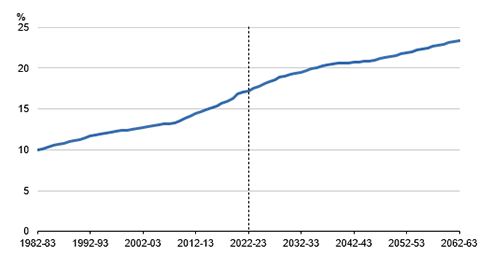
Source: Treasury.
Chart 4 shows the rate of increase in older persons. The rate of increase is forecast to be highest for the period between 2008–09 and 2028–29, due to the large baby boomer cohort ageing past 65.
The rate of increase peaked in 2020–21 as young temporary migrants departed the country with very few arriving to replace them due to international border restrictions (Chart 4).
Chart 4: Percentage point change in the share of population aged 65 and over
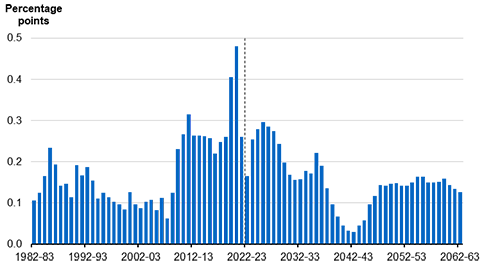
Note: Volatility in 2020-21 largely reflects changes in net overseas migration.
Source: Treasury.
The ageing of the population is one of the five powerful forces currently underway and it clearly drives one of the other forces – the rise in services and the care sector.
A permanently higher share of older people underpins the importance of the design of aged care services, and the tax and superannuation systems. The recent policy changes to promote the fiscal sustainability of superannuation and upcoming consultation on the effectiveness of superannuation in the retirement phase are two current examples of the types of changes that will be needed.
Participation
The labour force participation rate is expected to decline over the next 40 years, as the share of older Australians grows (Chart 5).
This is expected to be partially offset by higher participation by younger generations of Australians, particularly women. Older Australians will also have more options to continue to participate in paid work if they want to due to a combination of improved health and greater availability of less physically demanding jobs.
Chart 5: Historic and projected participation rates by sex
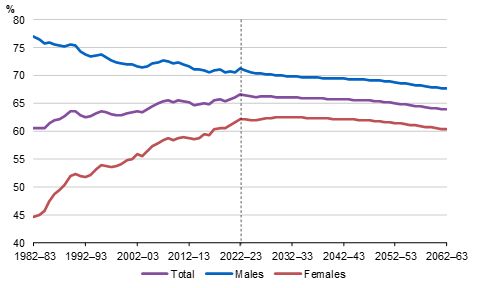
Source: ABS Labour Force and Treasury.
The near-term fiscal position is improving, but long-term challenges remain
Let’s now turn to the IGR’s fiscal projections.
In 2022–23, the Government recorded the first surplus since 2007–08. This is a very welcome development. However, the budget is projected to return to underlying cash deficit from 2023–24. Small deficits over the medium term will support a decline in gross debt-to-GDP from the COVID-19 peak of 39.3 per cent.
Deficits rise quickly from the 2040s to reach 2.6 per cent of GDP by 2062–63 (Chart 6) and debt rises again to 32.1 per cent of GDP.
Chart 6: Underlying cash balance

Note: Red bar is the 2022–23 underlying cash balance outcome. Blue bar in 2022-23 is the estimate as at 2023-24 Budget.
Source: Treasury.
Tax receipts are projected to rise to 24.4 per cent of GDP over the medium term and are then assumed to remain constant as a share of GDP from 2033–34.
While tax-to-GDP is assumed to remain constant, structural changes in the economy are projected to impact the composition of the tax base over the coming decades.
- Indirect sources of revenue are projected to decline as the decarbonisation of the transport industry and changing consumer preferences erode fuel and tobacco excise bases.
- Personal income tax is projected to grow as a share of the tax base over the IGR period to offset this decline in indirect taxes.
- And over time, population ageing is projected to result in a narrowing personal income tax base. Only 18 per cent of Australians aged 65 and above pay income tax.
Government spending is projected to grow by 3.8 percentage points of GDP from 24.8 per cent today to 28.6 per cent in 2062–63 (Chart 7).
- Spending on health, aged care, the National Disability Insurance Scheme (NDIS), defence and interest payments on debt, are projected to grow from one third of total government spending in 2022–23 to one half of all payments by 2062–63.
- Some payments decline as a share of GDP over the next 40 years. This includes education payments and family assistance payments, as the population ages.
Demographic ageing is estimated to account for around 40 per cent of the increase in payments, concentrated in health, age pension, and aged care spending.
- Non-ageing factors include a growing population, higher demand and sophistication in health and aged care services, and the geopolitical situation necessitating higher investment in Australia’s diplomatic and defence capability.
Chart 7: Receipts and payments
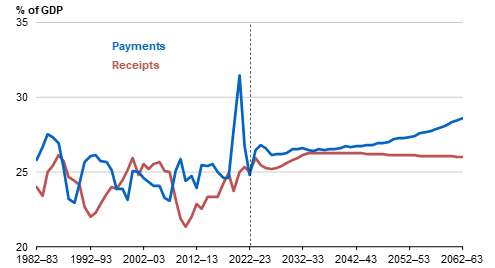
Note: 2022–23 estimates are as at 2023-24 Budget.
Source: Treasury.
The Australian Government’s payments for NDIS participants is the fastest growing payment category over the next decade. Payments are projected to rise from 0.9 per cent of GDP in 2022–23 to 2.1 per cent in 2062–63. This payment profile reflects the introduction of the NDIS Financial Sustainability Framework to moderate growth in scheme cost.
The IGR assumes the NDIS matures in 2043–44, with the annual growth in total expenses moderating towards maturity.
There is uncertainty about when the NDIS will reach maturity and begin to grow in line with the broader economy. In recognition of this uncertainty, the 2023 IGR includes scenarios for earlier and later maturity. The implications of these scenarios for payments are set out in Chart 8.
Chart 8: Comparison of major Australian Government payments in 2062–63 with NDIS scenarios

Note: NDIS payments refer to Australian Government Scheme participant payments. The earlier Scheme maturity scenario illustrates Scheme expenditure if growth moderates to nominal GDP from 2034–35. The later Scheme maturity scenario illustrates expenditure if growth moderates more slowly, approaching maturity towards the end of the IGR projection period. In this scenario, it is assumed growth moderates at a rate of 0.1 percentage points per annum from 2029–30 to 2062–63. At this rate, Scheme growth remains above nominal GDP growth until the end of the IGR projection period.
Source: Treasury.
Other advanced economies face similar fiscal challenges to Australia with anticipated growth in expenditure outstripping growth in revenue. For most other countries the necessary fiscal adjustments are expected to be much larger.
This is illustrated in Chart 9 which shows international net debt projections.
Arslanalp and Eichengreen recently highlighted the global challenges of public debt consolidation.[2] They argue that it is unlikely for global debt ratios to come back down to levels seen prior to the Global Financial Crisis in the foreseeable future. To achieve this, large, persistent fiscal improvements are likely needed in most countries.
The task of reducing public debts will be made all the more complicated by declining growth. This slower trend growth projection reflects the global slowdown in productivity, population, and participation I discussed earlier. Looking ahead, it is unlikely that nominal GDP growth will exceed interest rates by more than it does today, which will make it more difficult to lower debt-to-GDP.
Chart 9: International central government net debt projections
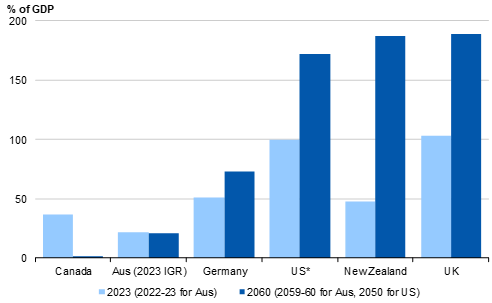
Note: Countries selected with published data on long-term fiscal projections. Definitions of net debt differ across countries, including the treatment of financial assets within respective debt measures. Federal government debt is reported for Australia, Canada and the US and general government debt is reported for the UK, New Zealand and Germany. *US debt projections end in 2050.
Australia, Canada and the United States are federal systems, so some services are funded at the sub-national level reducing debt recorded at the level of the central government
Source: US Congressional Budget Office (2023), UK Office for Budget Responsibility (2023), Canada Parliamentary Budget Officer (2022), NZ Treasury (2021), German Federal Ministry of Finance (2020), Treasury (2023).
20 years of economic outcomes since the 2002 IGR
It is over 20 years since the first IGR was published and it is worth considering how events have unfolded and how we have compared with other advanced economies.
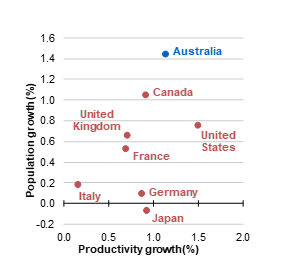
In Chart 10 we show that average productivity growth has been higher in Australia than all G7 economies except the United States over the past 20 years — a fact that often gets missed in discussions around our own productivity performance.
Our population growth has been higher than all the G7 nations reflecting higher migration.
Australia’s participation rate has also grown more than most G7 economies, with more women and older Australians participating in the labour market, as seen in Chart 11.
| Chart 10: Productivity and population growth in Australia and the G7, 20-year averages to 2021
|
Chart 11: Change in participation rate, 20 years to 2021
|
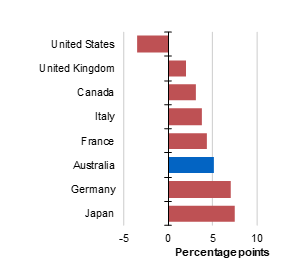
Note: Participation rates cover ages 15-64
Source: Organisation for Economic Co-operation and Development (OECD)
In Chart 12, we show 30, 20 and 10 year labour productivity growth rates. The chart shows the consistent slowing in productivity across all countries.[3]
Chart 12: International comparisons of labour productivity growth rates

Note: Averages calculated to 2021.
Source: Treasury analysis of OECD data.
There are many potential explanations for the global slowdown, as explored in the IGR and the 2022 edition of Treasury’s Economic Round Up. Declining economic dynamism and competition has reduced firms’ incentives to adopt technologies, and hampered the ability of resources to flow to more productive firms. Furthermore, many of the gains from past innovations and trade expansion, such as cheaper production and specialisation, have already been realised.
Let’s turn to the implications of slowing labour productivity, for long-term economic outcomes and the sustainability of the government’s fiscal position.
Increasing trend labour productivity growth by 0.3 percentage points, from the baseline of 1.2 per cent, increases the level of real GDP by around 9½ per cent and wages by 8½ per cent in 2062–63.
At the same time, the underlying cash deficit is reduced by 1.6 percentage points of GDP by 2062–63. The cumulative effect of smaller deficits is lower gross debt by 15.8 percentage points of GDP in 2062–63.
In light of the global slowdown in productivity growth it is worth asking whether scenarios involving persistently higher productivity growth rates for Australia are plausible.
This does not mean that productivity cannot grow more quickly in the short term and it doesn’t diminish the policy imperative for improving productivity as higher productivity in Australia is obtainable and that will generate permanently higher incomes.
But at some point, Australia’s productivity growth will converge with global rates and if global rates are lower in the longer term so will be Australia’s productivity growth.
This is an important consideration given the risks future generations could face from two of the powerful forces – climate and energy, and global fragmentation. And it only emphasises the importance of policies to mitigate the risk associated with these forces.
Population
Australia’s population is larger and younger than was projected in the 2002 IGR. The 2002 IGR projected population to reach 25.3 million in 2042, but this was surpassed in 2018–19.
Higher migration has been the primary driver of the larger and younger population compared to the 2002 IGR. The 2002 IGR assumed net overseas migration of 90,000 persons per year. Instead net overseas migration, between June 2002 and June 2022, averaged around 200,000 persons per year. The main reason for this increase was successive increases in the permanent Migration Program from around 108,000 persons in 2002‑03 to 190,000 by 2012‑13.
Fertility outcomes also contributed. Both IGRs had similar assumptions for the long-run total fertility rate, but the 2002 IGR did not anticipate the sudden rise in fertility in the mid-2000s, which saw the total fertility rate temporarily increase from 1.76 babies per woman in 2001–02 to a peak of 1.98 babies per woman in 2008–09 and remain elevated above previous levels until 2016–17.
Participation Rates
The participation rate has been much higher than the 2002 IGR projected (Chart 13) ending at 66 per cent in 2021–22 compared to around 60 per cent projected.
Indeed, successive IGRs have continued to underestimate the participation rate. This largely reflects less population ageing, mostly due to higher migration, and higher participation rates for women and older Australians.
Relatedly, past IGRs have not anticipated the substitution from hours to heads such that workers hours fell on average, but the number of workers rose as a share of the population.
The change reflects a number of interrelated changes across social attitudes, economic structure, education levels, fertility and health.
Chart 13: Participation rate – IGR projections and actuals
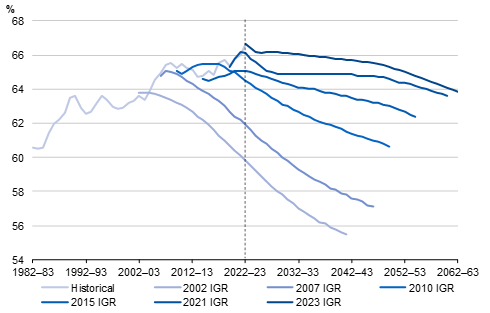
Source: ABS Labour Force and Treasury.
Economic Outcomes
Despite the significantly different outcomes in productivity, population and participation, the aggregate position of the economy and the shares of tax and expenditure at the end of the period have ended up close to the 2002 projections.
Real GDP grew by a total of around 70 per cent between 2002 and 2022, compared to 69 per cent projected.
A remarkable outcome given that:
- Productivity was much lower than expected, averaging 1.2 per cent per year compared to 1.8 per cent projected
- The population was much higher (around three million or 12 per cent) than projected, driven by net overseas migration around double what was assumed
- Participation was much higher, at 66 per cent in 2021–22, compared to around 60 per cent projected.
Finally, nominal GDP was stronger than expected, in part reflecting the mining boom’s boost to the terms of trade which is now well above the long-term average.
Chart 14: Real GDP growth
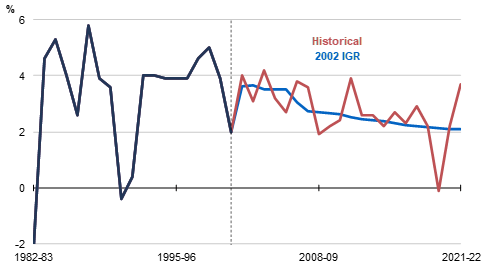
Source: ABS Australian National Accounts: Income, Expenditure and Product, and Treasury.
Fiscal outcomes since the 2002 IGR
Tax receipts excluding GST were slightly lower at 20.1 per cent of GDP compared to 20.8 per cent projected for 2022. Note, this excludes GST and other non-tax receipts to match what was projected as convention in 2002.
Payments were slightly lower at 26.7 per cent of GDP compared to the 26.9 per cent projected in the 2002 IGR.
- Payments that were lower:
- Health spending was 4.6 per cent of GDP in 2021–22 compared to 5.2 per cent of GDP projected, largely reflecting demographic changes, such as slower than expected population ageing
- Age pension spending was 2.2 per cent of GDP in 2021–22 compared to 3.6 per cent projected, due to a smaller share of people of pension age and rising superannuation balances
- Transfers to individuals were 2.3 per cent of GDP in 2021–22 compared to a projection of 3.1 per cent of GDP.
- Payments that were higher:
- Total interest payments were 0.8 per cent of GDP in 2021–22, but were projected to be zero in the 2002 IGR. Indeed, the 2002 IGR projected that there would be net interest receipts rather than payments
- NDIS (not envisaged in 2002) increased payments by 0.8 per cent of GDP
- Aged care spending was 1.1 per cent of GDP in 2021–22 compared to a projection of 1.0 per cent of GDP in the 2002 IGR
- The rest of payments increased by around 0.9 per cent of GDP between the 2002 IGR’s projections and actuals to 2021–22.[4]
The impact of unanticipated events – the GFC and COVID-19 – can be seen in net debt.
The 2002 IGR was projecting continuous underlying cash surpluses from 2002 to 2022. So, although average real economic growth was the same, the net debt position is quite different.
Net debt was 31.7 percentage points of GDP higher in 2022 than projected (Chart 15).
Chart 15: Net debt
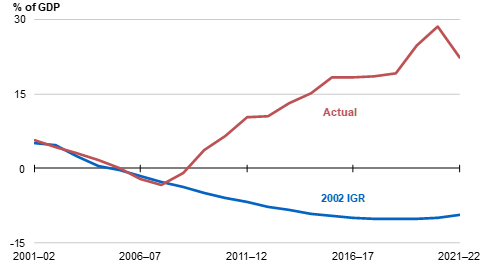
Source: Treasury.
Since reaching a historically low level in 2007, debt has risen due to a combination of economic and fiscal factors, such as the Global Financial Crisis. The COVID-19 pandemic and associated policy response led to another sharp increase in gross debt, reaching 39.3 per cent of GDP in 2020–21 – the highest level since the aftermath of the Second World War.
Increases in debt during economic downturns allows the budget to help stabilise and support the economy. However, this debt should be reduced when economic conditions are sound. This will rebuild fiscal buffers, ensuring the budget remains well placed to respond to future macroeconomic instability. It will also support government’s ability to meet future fiscal pressures, such as the response to climate change and the increasing demand for care and support services.
The Government has identified this as a priority and has committed to reducing gross debt as a share of the economy.
Conclusion
IGRs have been, and continue to be, a great reminder of the importance of fiscal transparency and sustainability. As the economy and the fiscal situation change, so too will the IGR – helping us to remain vigilant and disciplined in the interest of future generations.
There were some significant advances in the 2023 IGR. For the first time, we placed the previously domestically focused IGR in the context of the big global economic and security shifts. We made significant inroads into the complex area of climate modelling, which captured some of the physical effects of climate change for the first time.
Importantly these improvements have helped shed light on the factors that matter in the long term and the risks and opportunities that may result.
The Treasurer has committed to releasing the IGR more frequently and Treasury is taking this opportunity to be more systematic in our approach. This includes moving to a more transparent three-year cycle of development and advancement.
I will not ruin the surprise today for the 2026 IGR, but I will mention a few areas of focus for us.
A first and obvious focus will be to continue to build our capability on climate and net zero transformation modelling, including the implications for Australia’s industrial base and the terms of trade.
We are looking to build on our work to analyse population growth and the role of migration, including to further explore the differences between permanent and temporary migration and the implications for the broader economy.
Lastly, we have shown that economic cycles can have large persistent fiscal impacts. While downturns are impossible to predict, particularly 40 years out, we will look to include some scenarios that better illuminate this risk to the fiscal position.
[*] I would like to express my appreciation to Oliver Richards, Nathan Deutscher, Ray Harris, Leo Soames, Patrick Fazzone and James Ottaway for their assistance in preparing this speech.
[1] United Nations, Department of Economic and Social Affairs Population Division, ‘World Population Prospects 2022’ Population (2022); Commonwealth of Australia, ‘Intergenerational Report 2023: Australia’s future to 2063’ (2023); see for example Congressional Budget Office, ‘The 2023 Long-Term Budget Outlook’ (2023).
[2] Arslanalp, S. and Eichengreen, B. (2023) Living with High Public Debt.
[3] While the story is more complex for multi-factor productivity, the same broad conclusions can be drawn about the global productivity slowdown and Australia’s relative position.
[4] The 2002 IGR did not detail all payment categories so this represents a residual measure, but likely includes the impact of higher infrastructure and defence payments.