List of Charts and Tables
Charts
International Economy
| 1. | Selected International Indicators |
National Accounts
| 2. | Contributions to Trend GDP Growth |
Tables
National Accounts
| Components of Gross Domestic Product | ||
| 2. | Contributions to Change in Gross Domestic Product | |
| 3. | Gross Product by Industry | |
Incomes, Costs and Prices
| 4. | Real Household Income |
| 5. | Wages, Labour Costs and Company Income |
| 6. | Prices |
| 7. | Labour Market |
External Sector
| 8 | Balance of Payments |
| 9. | Australia’s External Liabilities |
| 10. | Australia’s Income Flows |
| 11. | Selected Economic Indicators |
Key to Tables
| n.a. | not available |
| n.y.a. | not yet available |
| .. | change less than 0.05 per cent |
Chart 1: Selected International Indicators
Panel A: Short-term Interest Rates(a)
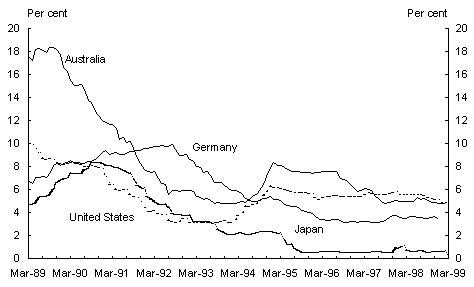
- Short-term interest rates are monthly average and defined as follows: US — 3-month certificates of deposits, Japan — 3-month certificates of deposit, Australia — 90-day bank accepted bills and germany — 3-month FIBOR.
Source: OECD Main Economic Indicators.
Panel B: Real Output(a)
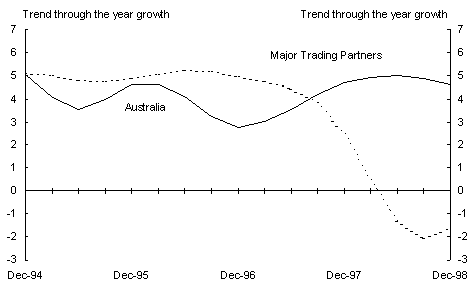
- Seasonally adjusted real GDP growth for each major trading partner is weighted by their respective shares of total Australian merchandise exports from 1995-96 to 1997-98. The major trading partners are composed of OECD and Asian major trading partners. Major trading partners from the OECD countries include the G7 (Japan, US, UK, Germany, France, Italy and Canada) and New Zealand. Asian major trading partners comprise South Korea, Taiwan, Hong Kong, Singapore, China, Malaysia, Indonesia, Thailand and the Philippines.
Panel C: Current Account Balances(a)
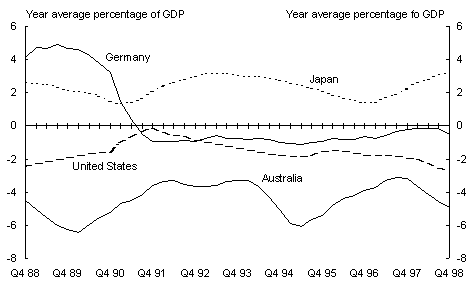
- Data are seasonally adjusted. Germany refers to Western Germany until June 1990, unified Germany thereafter.
Source: All the data are sourced from statistical agencies of respective countries, except Germany which is sourced from the OECD Main Economic Indicators.
Panel D: Consumer Price Inflation(a)
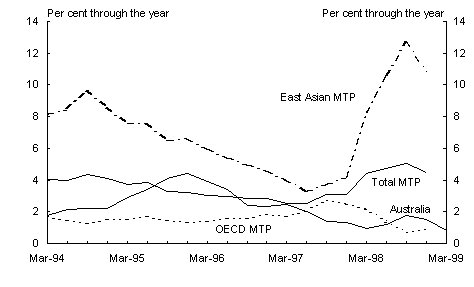
- The aggregate inflation rates are derived as the weighted average of the inflation rates of individual trading partners, with the weights being their respective shares of Australian total merchandise trade from 1995-96 to 1997-98.
Data for major trading partners (MTP) is sourced from the ABS All Groups (excluding housing) CPI measure for the countries for which it is available and this includes US, Japan, Germany, UK, New Zealand, Canada, South Korea, Singapore, Indonesia, Taiwan and Hong Kong. For the rest of Australia’s MTP (France, Italy, China, Malaysia, Thailand and the Philippines), the CPI are sourced from each country’s respective all groups CPI series which exclude the effect of mortgage interest rates.
Chart 2: Contributions to Trend Quarterly GDP Growth (Average 1996-97 Prices)
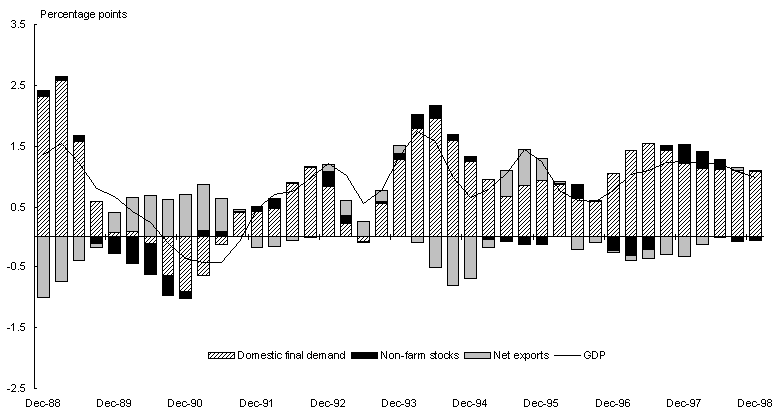
Table 1: Components of Gross Domestic Product (chain volume measures)
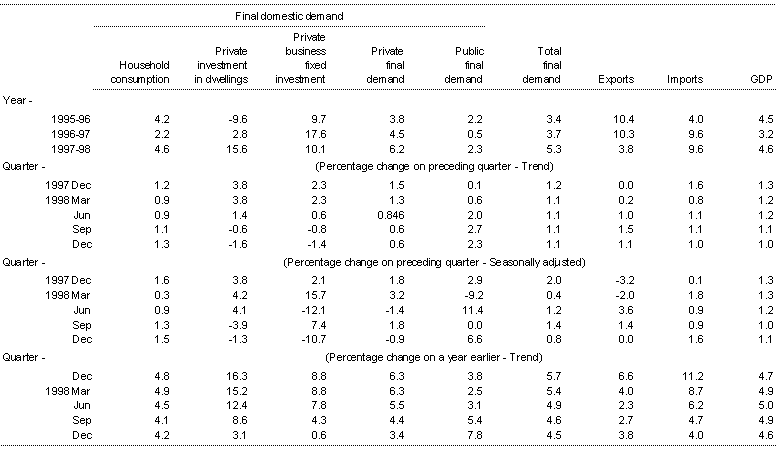
Source: ABS Cat. Nos. 5204.0 and 5206.0
Table 2: Contributions to Change in Gross Domestic Product (chain volume measures)
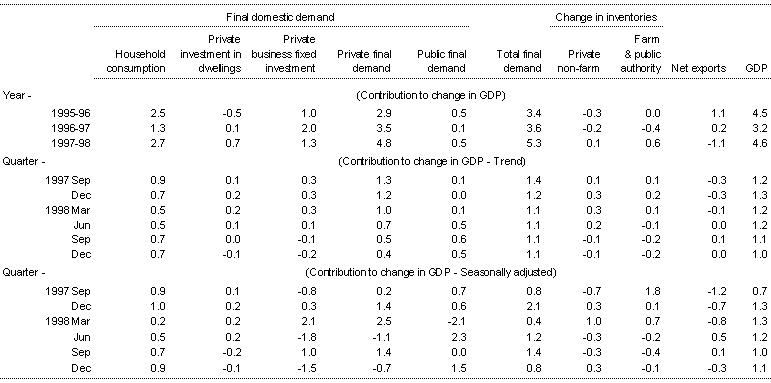
Source: ABS Cat. Nos. 5204.0 and 5206.0
Table 3: Gross Product by Industry (chain volume measures)
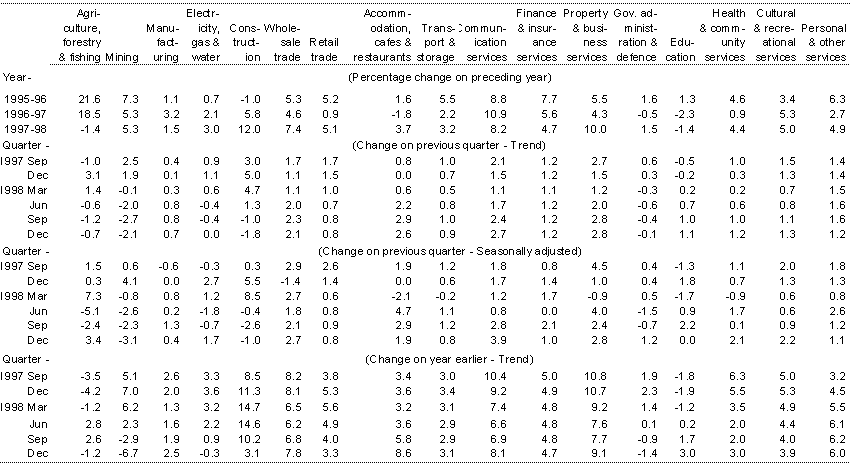
Source: ABS Cat. Nos. 5204.0 and 5206.0
Table 4: Real Household Income(a)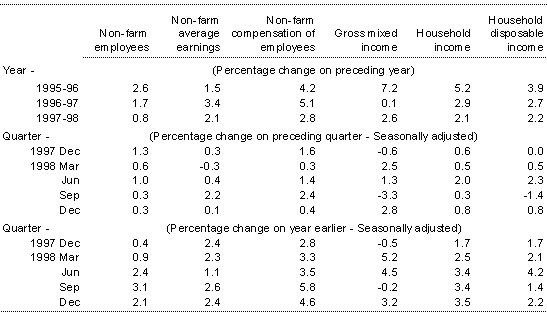
- Deflated by the implicit price deflator for private final consumption expenditure.
Source: ABS Cat. Nos. 5204.0 and 5206.0
Table 5: Wages, Labour Costs and Company Income
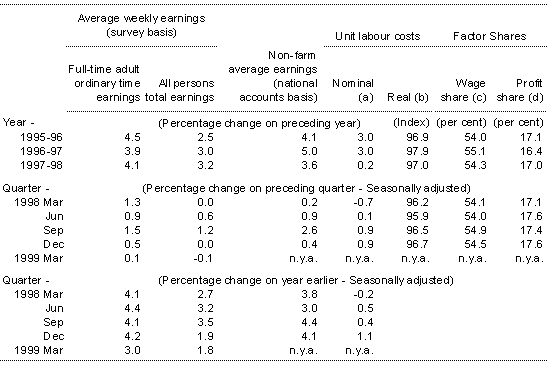
- Ratio of nominal hourly labour costs (non-farm compensation of employees, plus payroll tax and fringe benefits tax less employment subsidies, per hour worked by non-farm wage and salary earners) to average hourly productivity (real gross non-farm product per hour worked by all e
mployed persons). - Nominal unit labour costs as defined in footnote (a) deflated by the derived implicit price deflator for gross non-farm product. (Base for index: 1986-87 = 100.0)
- Compensation of employees as a share of gross domestic product at factor cost.
- Gross operating surplus of private non-financial corporations as a share of gross domestic product at factor cost. (Base for index: 1986-87 = 100.0)
Sources: ABS Cat. Nos. 5204.0, 5206.0, 5222.0 and 6301.0
Table 6: Prices
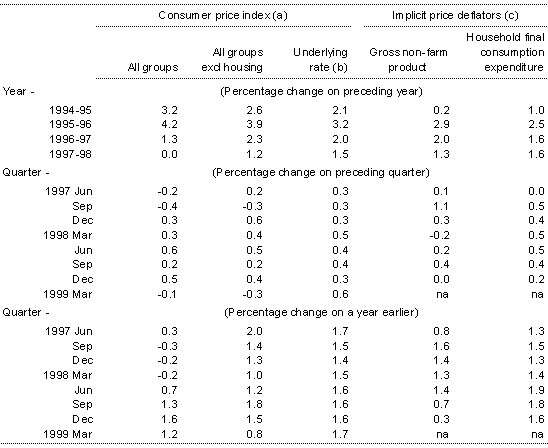
- Based on the eight capital cities consumer price index.
- ABS estimate based on Treasury methodology. An article on the construction of this estimate appeared in the Summer 1995 edition of Economic Roundup.
- Quarterly figures are derived from seasonally adjusted data.
Sources: ABS Cat. Nos. 6401.0, 5204.0 and 5206.0
Table 7: Labour Market
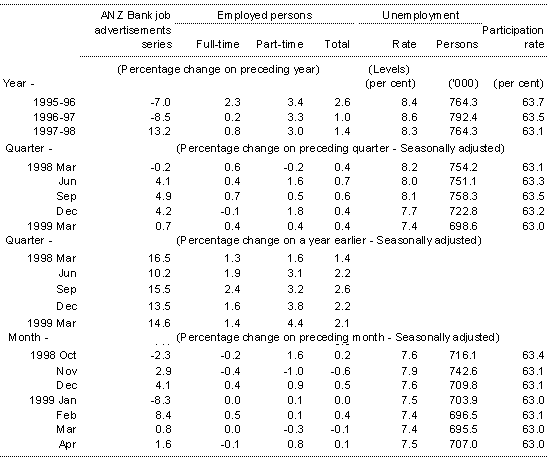
Sources: ANZ Bank and ABS Cat. No. 6202.0
Table 8: Balance of Payments
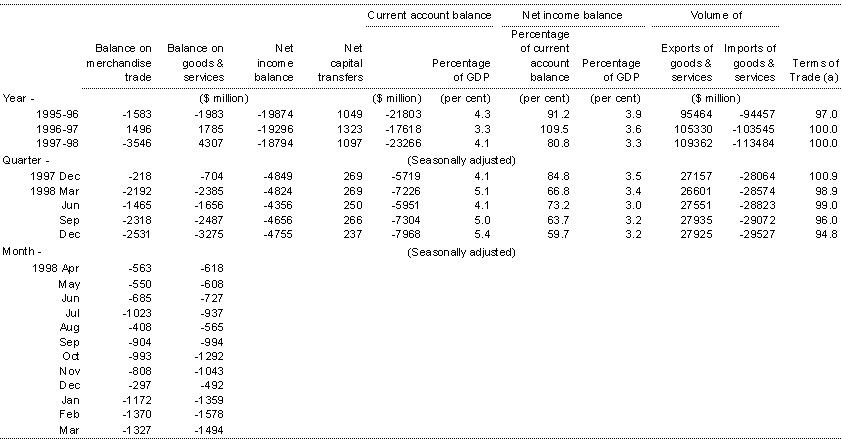
- The ratio of the implicit price deflator for exports of goods and services to the implicit price deflator for imports of goods and services, 1996-97 = 100, calculated on a National Accounts basis.
Sources: ABS Cat. Nos. 5368.0, 5302.0, 5204.0 and 5206.0.
Table 9: Australia's External Liabilities
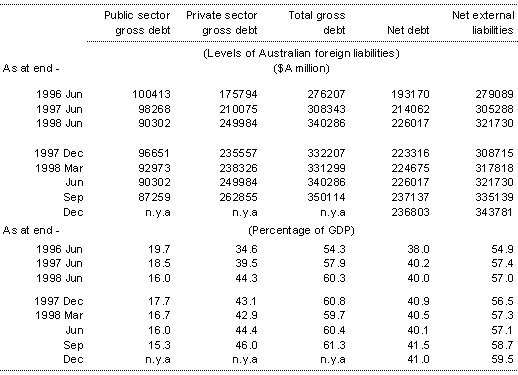
Sources ABS Cat. Nos. 5302.0, 5204.0 and 5206.0
Table 10: Australia’s Income Flows
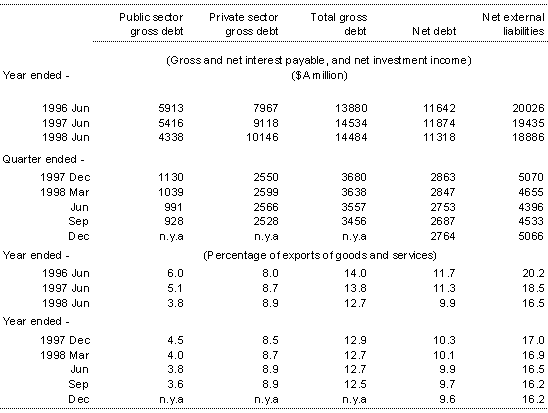
Source: ABS Cat. No. 5302.0
Table 11: Selected Economic Indicators

- ABS National Accounts measure. All numbers derived from seasonally adjusted data.
- A discussion of these indices and detailed figures covering the period from the September quarter 1970 to the March quarter 1983 may be found in a supplement to the July 1983 Roundup of Economic Statistics titled 'International Comparisons of Relative Price and Cost Levels'.
- The weights used are based on a 3 year moving average of Australia's imports from the US, Japan, UK and Germany. The four countries are the source of about 60 per cent of Australia's imports. Observations are quarterly averages. A rise (fall) implies a deterioration (improvement) in Australian costs and prices relative to the four countries above after adjusting for exchange rate changes.
- The CPI based index is the ratio of the Australian Consumer Price Index to the weighted geometric average of the exchange rate adjusted consumer price indices of Australia's four major import sources.
- The GDP deflator based index is the ratio of the GDP deflator for Australia to the weighted geometric average of the exchange rate adjusted GDP deflator of Australia's four major import sources.
- The unit labour cost based index is the ratio of unit labour costs in the non-farm sector of the Australian economy to the weighted geometric average of the exchange rate adjusted unit labour costs in the business sector for Australia's four major import sources.
- Ratio of household saving to household disposable income.
- Quarterly data are seasonally adjusted except for the trade weighted index and the nominal exchange rate.
- Period Average, May 1970 = 100.
Sources: ABS Cat. Nos. 5206.0 and 5302.0