The aims of 'The New Tax System' (introduced in July 2000) were to comprehensively reform revenue collection, lower personal income taxes, increase family assistance benefits and other government benefits and to create a simpler, fairer and more efficient tax system.
Prior to its introduction, critics of the tax reform package predicted that the changes could have serious adverse effects on the economy. The preliminary assessment in this article indicates that these adverse predictions have not been realised.
The article assesses the short-term macroeconomic impact of 'The New Tax System', examines the impact of tax reform on incomes, and discusses issues associated with implementation. While there have been a number of transitional impacts associated with tax reform, these appear to have 'washed out' over the first two years.
A comparison of the real disposable income of Australian families (by family type and quintile) before the introduction of tax reform and twelve months afterwards, shows that all groups have gained.
In addition, data suggest that Australia's recent tax reform experience has been relatively smooth compared with other countries that have undertaken taxation reforms broadly similar to those of 'The New Tax System'.
Impact of The New Tax System on the Australian economy
Transitional effects on the Australian macroeconomy
Economic activity
Dwellings
Household consumption expenditure
Labour market
Prices and wages
Income tax cuts
Families
Older Australians - pensioners, part pensioners and self-funded retirees
Other benefits of The New Tax System
Impact on Australian families - a population distributional analysis
Benefits for business
Compliance with the tax system
Impact of the tax reform - over two years on
Appendix A: The experience of Canada, Japan, New Zealand and Singapore
Appendix B: Approach taken for distributional analysis
Introduction
The Australian Government announced its intention to reform the taxation system in 1998. In doing so, it argued that the then existing tax system, which had been largely designed in the 1930s, would struggle to support Australia's increasingly sophisticated, service based export economy far into the future.
In planning The New Tax System (TNTS), the Government's aim was to comprehensively reform revenue collection and family assistance arrangements to create a simpler, fairer and more efficient tax system that would establish a framework for economic activity in Australia that would be more relevant for the twenty first century.
In general terms, the Government's reforms sought to:
- cut personal income taxes;
- broaden the tax base by replacing the narrowly based and multi-rated Wholesale Sales Tax (WST) with a Goods and Services Tax (GST) at a single rate on a broad range of products. Broadening the tax base ensures more secure revenue over time, removing the need for ad-hoc tax initiatives;
- increase assistance to families;
- increase pensions and benefits;
- simplify the tax system by:
- abolishing ten indirect taxes and introducing one single rate GST;
- with all GST revenue going directly to the States and Territories to replace general purpose funding and to compensate for the loss of other indirect tax income;
- streamlining the structure and administration of family assistance administration arrangements; and
- introducing the Australian Business Number (ABN) as a single identifier for all government purposes;
- abolishing ten indirect taxes and introducing one single rate GST;
- improve the productivity of the investment capital of Australian businesses, particularly exporters, by removing investment distortions built into the previous system; and
- reduce opportunities for tax evasion.
The Government expected that the tax reform package would have a significant Budget cost (although less than one per cent of GDP annually) but would bring sustainability to both Commonwealth and State finances. In addition, it was designed to be consistent with the Government's medium-term fiscal strategy. The tax package was expected to be accommodated while retaining Budget surpluses over the economic cycle as required by the fiscal strategy.
Critics of the tax reform package announced in 1998 predicted that: it would send the economy into recession; alternatively, it would pour fuel on an already over-heated economy; it would lift the rate of inflation on an ongoing basis; it would lead to widespread loss of employment; compensation would be inadequate; there would be increased incentive for businesses to operate in the cash economy; business compliance costs would be raised substantially and permanently; and business bankruptcies would be widespread. These predictions do not appear to have been realised.
TNTS was introduced in July 2000 - over two and a half years ago. This article provides a preliminary assessment of the impact of TNTS in light of the concerns foreshadowed before its implementation. While there were a number of transitional impacts associated with tax reform, overall these appear to have 'washed out' largely as expected over the first two years. There do not appear to have been the large scale adverse impacts that some critics had predicted.
The article first provides an assessment of the short-term macroeconomic impact of tax reform. The second part of the article examines the impact of the tax reform on incomes. The third part discusses implementation issues.
It is still too early to make a full assessment of the long run impact of tax reform. However, the outcomes to date have been broadly consistent with official forecasts.
Impact of The New Tax System on the Australian economy
TNTS reforms were expected to have both short-term (or transitional) effects and long-term effects on the Australian economy.
TNTS was expected to deliver a range of substantial long-term benefits, although as with other microeconomic reform, some of the benefits might take many years to be fully realised.
For this reason, it is still too early to fully analyse the anticipated positive long-term effects of TNTS on the economy, which are likely to become more apparent over the next decade. The article considers evidence of short-term or transitional effects of TNTS on the Australian economy over the past couple of years.1
As a point of comparison, Appendix A describes the experience of four other countries (Canada, Japan, New Zealand and Singapore) that have introduced tax reforms broadly similar to those of TNTS.
Transitional effects on the Australian macroeconomy
In general terms, the introduction of TNTS led to a once-off change in the price of many items in
the economy. The price of many goods and services rose as a result of the indirect tax reforms contained in the tax package, although some prices remained largely unchanged or even declined. The prices of most investment goods and services fell as the embedded cost of previous indirect taxes on business inputs was removed.
As expected, the prospect of changed relative prices had a short-term effect on the pattern of demand. In the lead-up to the introduction of TNTS, consumers responded in a reasonably predictable fashion to the anticipated price changes, bringing forward purchases of goods and services which were expected to increase in price and deferring purchases of products whose price was expected to fall. In a similar manner, businesses tended to defer expenditure in the expectation of lower prices for investment goods.
The economy temporarily slowed following the introduction of TNTS. Factors such as increases in official interest rates, higher oil prices, and the ending of expenditures associated with the Sydney Olympics are likely to have contributed to this short period of weakness, exacerbating the effects of the unwinding of some of the bring-forward of spending associated with TNTS.
Economic activity
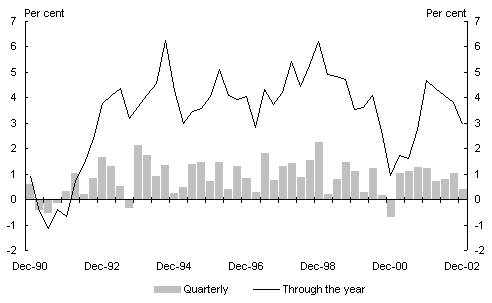
Since the introduction of TNTS, the economy has continued the solid growth performance of the 1990s, despite experiencing a temporary slowdown in the second half of 2000. The strong performance has occurred against a backdrop of global and regional economic weakness. In recent times, Australia has been one of the fastest growing industrialised countries and international agencies such as the OECD and IMF have indicated that they expect Australia to continue to be one of the best performing developed economies in the world.
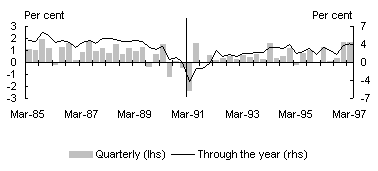
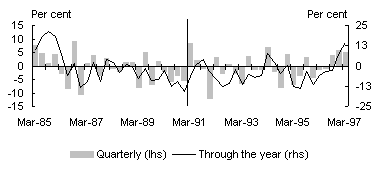
The temporary slowdown in the second half of 2000 (Chart 1), immediately following the introduction of TNTS, followed three years of very strong (year-average) growth of between 4.0 and 5.3 per cent per year.
Chart 1: Australian GDP growth
Source: ABS Cat. No. 5206.0.
The weakness was concentrated in the residential construction sector and related parts of the manufacturing sector. Although the key factors contributing to the slowdown in these sectors had been identified in advance, the timing and magnitude of their impact differed somewhat from expectations. In particular, the decline was concentrated more than expected in the September and December quarters of 2000 and the downturn was somewhat sharper (particularly in the dwellings sector) than had been anticipated.
As well as the sharp decline in the dwellings sector, a number of other factors contributed to the slowdown in overall growth in the second half of 2000. The growth rate of business investment, for example, fell below average as non-residential construction continued to decline from its peak in 1998-99. A significant part of this was a result of the Olympics-related work being exhausted and the completion of several large engineering construction projects. Slower growth in investment in information and communications technology probably also reflected previous Y2K-related investment and preparation for the introduction of TNTS. The contractionary effects of higher world oil prices and interest rates were also likely to have been contributing factors.
The economic slowdown in late 2000 proved to be short-lived. Growth rebounded sharply in the March quarter 2001 and has since been very solid, averaging almost 1 per cent per quarter, despite the weak international economy and the more recent emergence of the severe drought conditions across the nation.
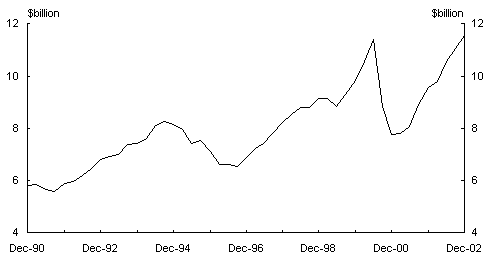
Dwellings
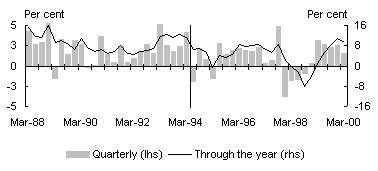
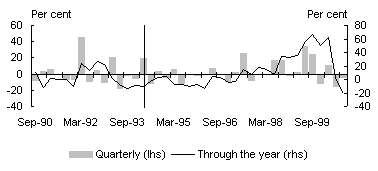
The sharp but temporary decline in dwelling investment was the most significant factor contributing to the slower-than-expected growth of the economy in the second half of 2000 (Chart 2). The fall in dwelling investment directly subtracted around 1¼ percentage points from overall GDP growth in 2000-01. Excluding the direct effect of the slowdown in dwellings, and with other factors unchanged, year-average GDP growth would have been around a solid 3 per cent for the year.
Chart 2: Residential construction - total dwelling investment
Source: ABS Cat. No. 5206.0.
Prior to the introduction of TNTS, dwelling investment increased faster than underlying demand as homebuyers sought to bring-forward their house purchases ahead of 1 July 2000. This led to dwelling investment rising to its highest level in almost 20 years.2 The decline in construction of new dwellings in 2000-01 as a whole was broadly in line with earlier expectations. However, it was much more heavily concentrated in the September and December quarters (with a cumulative decline of almost 40 per cent in those two quarters) than had seemed likely around the time of both the 2000-01 Budget and the 2000-01 Mid-Year Economic and Fiscal Outlook.
The decline in residential construction activity was not confined to new dwelling investment. The alterations and additions component, which comprises around 40 per cent of total dwelling investment, also fell by a record amount in 2000-01 following a sustained period of strong growth over most of the 1990s.
The fall in the alterations and additions component was also concentrated in the September and December quarters of 2000, with a decline of around 25 per cent over those two quarters. This was unexpected, especially as the magnitude of the bring-forward in this component was more modest.
Interestingly, according to the ABS,3 the price of materials used in house building increased by around 5.3 per cent over the period in which dwelling construction boomed ahead of the TNTS introduction, while prices actually fell for several quarters in the period immediately following the introduction of the GST applying from 1 July 2000.
Although the magnitude of the decline and its impact on the dwellings sector and the economy more generally was significant, the housing sector stabilised quickly and returned to strong growth in 2001. This was aided by historically low interest rates and the Government's enhanced First Home Owners' Scheme (introduced in March 2001). Dwelling investment has continued to grow strongly since that time, although leading indicators are suggestive of a slowing this year.
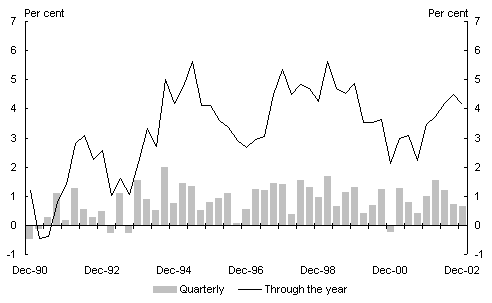
Household consumption expenditure
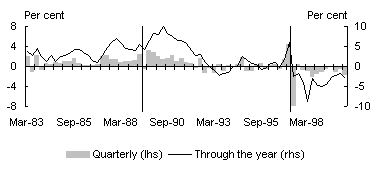
Household consumption expenditure (Chart 3) grew by 3.0 per cent in 2000-01, slowing from the very strong rates of growth recorded in earlier years. This moderation in growth, while concurrent with tax reform, appears not to have been caused by it. Rather, the transitional effects on consumption expenditure related to the implementation of the TNTS package appear to have been broadly offsetting, with a bring-forward of spending on a number of retail trade items largely offset by the deferral of purchases of other items such as passenger motor vehicles (see below). The net effect on consumption growth in 2000-01 appears to have been relatively small and in line with expectations.
Chart 3: Household consumption expenditure growth
Source: ABS Cat. No. 5206.0.
The slower rate of overall household consumption growth
in 2000-01 related to a number of factors including:
- higher fuel prices, which reduced funds available for more discretionary expenditure (the automotive fuels component of the Consumer Price Index increased by almost 12 per cent over the September and December quarters of 2000, driven by significant increases in world oil prices);
- higher interest rates during the course of 2000 (official interest rates were increased by a total of 125 basis points between January and August 2000);
- the dampening effect of the weaker housing sector; and
- slow growth in private sector wealth.
Household consumption growth rebounded strongly in the first half of 2001 as some of the factors that were constraining growth in the second half of 2000 unwound. In particular, petrol prices declined, interest rates were reduced and growth in private sector wealth increased strongly, mainly reflecting the sharp rise in property values (which increased by around 6 per cent in the first half of 2001). Total household consumption expenditure grew by 2.0 per cent over the March and June quarters of 2001 and has remained strong since.
Retail sales and motor vehicle sales
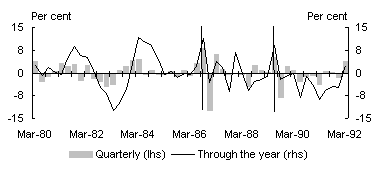
There appears to have been some transitional TNTS-related effects in retail sales (Chart 4). Large swings occurred in department store sales, household goods and clothing sectors in particular - strong growth in the June quarter of 2000 was followed by a sharp decline in the September quarter and a rebound in the December quarter. The pattern of these transitional effects was broadly anticipated.4 Allowing for the usual data volatility, expenditure patterns appear to have returned quickly to what could be considered more 'typical' levels.
Chart 4: Retail sales growth
Source: ABS Cat. No. 8501.0.
There was clearly some deferral in the purchase of new motor vehicles (Chart 5) in anticipation of the lower prices available following the implementation of TNTS. Given the nature of such purchases (relatively large and infrequent) and size of the potential savings involved (TNTS significantly reduced the price of cars in Australia, replacing a 22 per cent wholesale sales tax rate with a 10 per cent GST on the purchase price of cars), it would be expected that the change in the pattern of behaviour (in this case a deferral of expenditure) would commence earlier than for many other components of household expenditure. This appears to have been the case. In contrast with the behaviour observed in the retail trade data, for example, the deferral appears to have been in place for some months ahead of the introduction of taxation reform.
Looking through the volatility of the data, the motor vehicle sector appears to have returned quickly to more typical levels of activity following the implementation of the taxation reforms.
Chart 5: Sales of new motor vehicles(a)
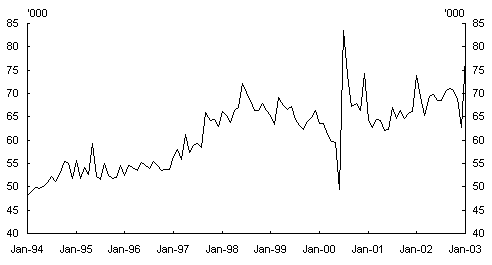
(a) Series commences in January 1994.
Source: ABS Cat. No. 9314.0.
Labour market
Employment (Chart 6) increased by a solid 2.1 per cent in 2000-01, with the downturn in the labour intensive construction sector (both residential and non-residential, as discussed previously), reversing a large part of the very strong employment growth that had occurred in the first two months of the 2000-01 financial year. Employment declined in the December quarter 2000, although this followed a period of sustained solid employment growth, and the unemployment rate rose to a peak of 6.8 per cent in mid to late 2001.
Chart 6: Employment growth and the unemployment rate
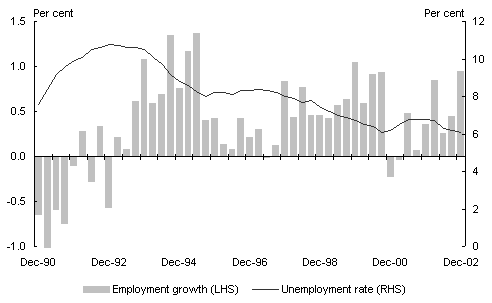
Source: ABS Cat. No. 6202.0.
It is likely that this employment effect in the construction sector and related parts of the economy was compounded in late 2000 and into 2001 by the global economic downturn and the uncertainty this added to the economic outlook - firms are likely to have adopted a relatively cautious approach to employing new workers in light of this additional uncertainty. Higher interest rates may also have had an adverse effect on employment growth.
Since then, however, year-average employment growth has been solid, growing by around 2 per cent in the past year. The unemployment rate peaked at 6.8 per cent in 2001, markedly lower than the peak of previous employment cycles. Importantly, the unemployment rate has trended downwards over the course of 2002 to be around 6 per cent, and with solid domestic fundamentals in place, there are good prospects for these positive labour market outcomes to continue.
Prices and wages
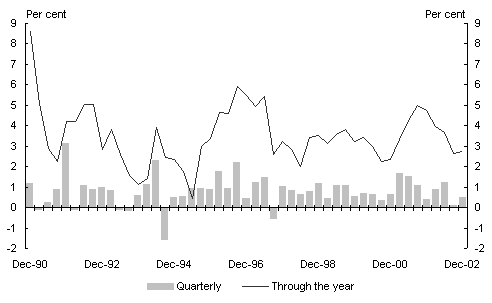
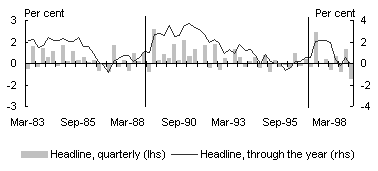
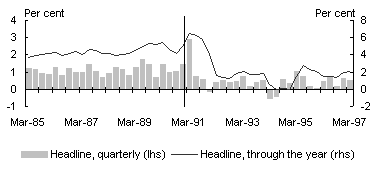
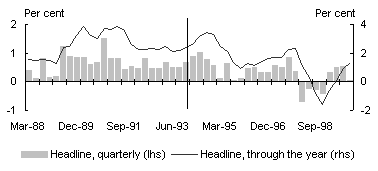
As noted above, the introduction of TNTS led to a once-off change in the price level of many items in the economy. An indication of the 'overall' effect on consumer prices can be observed in movements of the Consumer Price Index (CPI) (Chart 7).
Chart 7: Headline and 'ongoing' inflation
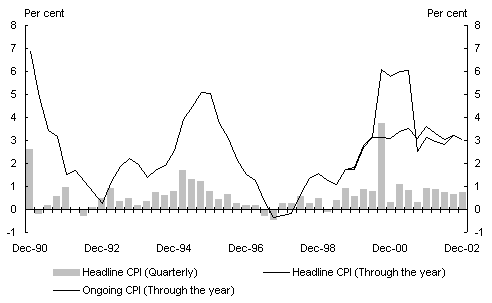
Source: ABS Cat. No. 6401.0, Treasury estimates.
The main price effect was recorded in the September quarter 2000, with the CPI rising by 3.7 per cent. TNTS is estimated to have contributed a little less than 3 percentage points to the overall CPI increase in the quarter, significantly lower than the 3¾ percentage points forecast in the 2000-01 Budget. Quarterly inflation outcomes, while exhibiting some volatility, generally returned to more typical levels from the December quarter 2000. This single 'spike' in the quarterly CPI data confirms that the inflationary impact of the TNTS reforms on prices was essentially once-off in nature and did not become entrenched in inflation outcomes or inflation expectations.
The role of the Australian Competition and Consumer Commission (ACCC) in monitoring price rises immediately following the introduction of the TNTS reforms and preventing opportunistic pricing behaviour was also a factor in helping to restrain the inflationary pressures in the economy.
For the 2000-01 financial year in total, the headline CPI increased by 6.0 per cent in through-the-year terms. TNTS is estimated to have contributed around 2½ percentage points of this increase.5
Also shown in Chart 7 is Treasury's estimate of the CPI excluding the effect of TNTS - the 'ongoing' CPI series. The 'ongoing' CPI was affected by various once-off and temporary price influences over the year - such as petrol (driven by large increases in world oil prices) and fruit and vegetable prices (which were affected by adverse seasonal conditions). Excluding the effects of both TNTS and these once-off factors, the CPI would have increased by around 2¾ per cent in through-the-year terms in 2000-01, in line with the 2-3 per cent medium term inflation target band.
The rate of 'ongoing' inflation in 2001-02 is estimated to be a little higher than the headline CPI measure. This reflects the fact that TNTS acted to reduce the rate of headline inflation in 2001-02, through measures such as the removal of stamp duty on marketable securities, the removal of financial
institutions duty and the bring-forward of input tax credits on motor vehicles. In total, these measures are estimated to have reduced the headline CPI slightly, by around ¼ to ½ of a percentage point in 2001-02. Further measures announced as part of the TNTS reform package, including the removal of bank account debits taxes, are scheduled to be introduced in coming years, and could also be expected to slightly reduce the overall CPI impact of the package, although this effect will not be directly observable in the CPI data.
In the lead-up to the introduction of the TNTS package in Australia, consumer inflation expectations increased (Chart 8). However, inflation expectations quickly returned to more typical levels.
Chart 8: Consumer inflation expectations
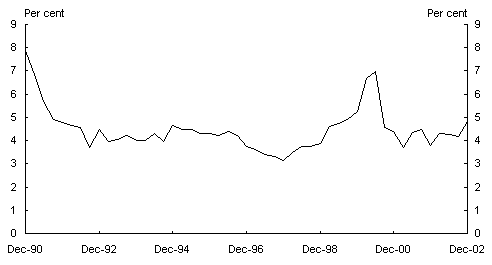
Source: Melbourne Institute.
Inflation expectations play a key role in wage negotiations - if workers believe that inflation is likely to increase, and be sustained at the higher level, they will revise their wage expectations upwards. An example of this type of behaviour was observed ahead of the taxation reforms, where a number of TNTS-related clauses were written into employment contracts, set to be triggered by higher than expected inflation. In the event, such clauses proved unwarranted and although wages growth (Chart 9) peaked at 5 per cent in the September quarter 2001 (mainly due to a variety of non-TNTS reasons), they have since moderated to levels consistent with ongoing productivity gains and associated with modest inflationary pressures.
Chart 9: Growth in wages
(National Accounts basis excluding Superannuation Guarantee Charge)
Source: ABS Cat. No. 5206.0, Treasury estimates.
Overall, the data indicate that the implementation of the TNTS reforms did not bring about the adverse impacts on the Australian economy that some critics had predicted. As the discussion above demonstrates, there were a number of (broadly anticipated) transitional impacts on various economic aggregates around 1 July 2000. However, these effects appear to have largely 'washed out' over the two years since, leaving the Australian economy well-placed to maintain its position as one of the world's top-performing developed economies.
Distributional impacts
TNTS incorporated significant personal income tax cuts and more generous family payments. There were also specific measures to compensate particular sectors of the community for the impact of the GST, such as older Australians and those outside the taxation and welfare systems.
Income tax cuts
There were significant changes made to both the marginal rates of tax and to the income thresholds at which the rates apply.
The lowest marginal tax rate was reduced from 20 per cent to 17 per cent. The 43 per cent and 34 per cent tax rates were reduced to 30 per cent.
There was also significant change in income tax thresholds, including an 11 per cent increase in the tax-free threshold to $6 000. The thresholds at which the 42 per cent rate and 47 per cent rates apply were increased to $50 000 and $60 000 respectively (noting that the Government's initial proposal was $75 000). The new 30 per cent rate applies to a much wider range of taxable income, from $20 001 to $50 000. The broadening of the income range over which the 30 per cent rate applies has moderated the impact of bracket creep on taxpayers with income in these ranges.
The old and new tax scales are shown below:
Table 1: Old and new tax scales
|
Old Scale
|
New Scale
|
||
|
Taxable Income ($)
|
Tax rate (%)
|
Taxable Income ($)
|
Tax rate (%)
|
| 0-5,400 |
0
|
0-6,000 |
0
|
| 5,401-20,700 |
20
|
6,001-20,000 |
17
|
| 20,701-38,000 |
34
|
20,001-50,000 |
30
|
| 38,001-50,000 |
43
|
||
| 50,001 + |
47
|
50,001-60,000 |
42
|
| 60,001+ |
47
|
||
Families
TNTS provided assistance to families beyond the personal income tax cuts, in recognition of the additional costs of children.
Under the new family assistance system, twelve types of assistance that had been available through the tax and social security systems were reduced to three. Assistance to families now comprises:
- Family Tax Benefit (Part A) (FTB(A)) helps families with the costs of raising children.
- Family Tax Benefit (Part B) (FTB(B)) provides additional assistance to single income families, including sole parents.
- Childcare Benefit (CCB) provides help to families with the costs of childcare outside the home.
In addition, the first child tax offset ('baby bonus') was introduced in 2001-02.
The new family assistance system also provided families with choice of how they receive their payments - either fortnightly through Centrelink or as a lump sum when they lodge their income tax return.
- Eligibility for payments is based on current year income and ensures equity between families regardless of how they choose to receive family assistance.
- The reconciliation between estimated and actual income that occurs when tax returns are lodged ensures that families receive their correct entitlement.
- Families became entitled to top up payments for the first time if they overestimated their income.
- If families underestimated their income they would receive an overpayment which would need to be repaid.
- Since its introduction, the Government has introduced a number of measures to assist families to estimate their income and to reduce the potential for overpayments.
The rates of assistance were increased, as were the income thresholds from which family benefits begin to be reduced. The income test taper rate6 was reduced from 50 per cent to 30 per cent. The payments and the income thresholds are indexed annually in line with movements in the CPI.
The Family Adjustment Payment (FAP) was introduced to ensure that families were not financia
lly disadvantaged from the changed arrangements for the provision of assistance to families. 178 families received a lump sum payment under FAP.
Older Australians - pensioners, part pensioners and self-funded retirees
The key benefits delivered by the Government to older Australians were: higher pensions and allowances and increased access to the age pension; reductions to personal income and capital gains tax rates; refunds of imputation credits; and the abolition of financial institutions duty and stamp duty on marketable securities.
Higher pensions and allowances and increased access to the age pension
Increases in the age pension and other allowances were a key aspect of tax reform.
The age pension increases every six months in line with the CPI. Prior to tax reform, the Government had also legislated a commitment that the single pension rate be maintained to at least 25 per cent of Male Total Average Weekly Earnings (MTAWE) with proportional flow-ons to the partnered rate.
With tax reform, the maximum pension was increased by 2 per cent in addition to the twice-yearly increase provided for by regular indexation. The 2 per cent increase due to tax reform maintains its value over time because it increases in line with the CPI.
This tax reform increase is being paid in addition to the commitment to ensure that the single pension rate remains at 25 per cent of MTAWE. In this way, the Government is delivering a permanent real increase over and above any pension rises that otherwise would have occurred over time.
Part-rate pensioners are now also able to keep more pension for every dollar of private income they receive above the income test free areas, as a result of the reduction in the pension withdrawal rate from 50 per cent to 40 per cent.
Australian Bureau of Statistics (ABS) data shows that between March 2000 and September 2002, the CPI increased by 10.6 per cent.7 In the same period, the age pension increased by 15.4 per cent (an increase of $57.40 a fortnight in the single rate) for full rate pensioners.
The pension income and assets tests' thresholds were also raised by 2.5 per cent as part of tax reform and the pension income test withdrawal rate was lowered from 50 cents per additional dollar to 40 cents per additional dollar. This means that more older Australians are able to access a part age pension and the associated benefits of the pensioner concession card.
Bonuses for older Australians
As part of TNTS, the Government also provided bonuses to older Australians with income from savings and investments. The Government delivered over $2.1 billion of benefits to older Australians by way of this measure alone. In all, around 2.2 million older Australians received bonuses.
Pensioners, part pensioners and self-funded retirees with income from savings and investment were eligible for a one-off, means tested, non-taxable Aged Persons Savings Bonus of up to $1 000 where they were aged 60 years or more on 1 July 2000.
A one-off, means tested, non-taxable Self-Funded Retirees Supplementary Bonus of up to $2 000 was available for self-funded retirees aged 55 years or more who were not in receipt of a Commonwealth income support payment and did not have business income or wage income of $1 000 or more in the 1999-2000 financial year.
In order to allow older Australians to maximise their bonus payments, bonuses could be based on either the 1998-99 or 1999-2000 financial years.
Refunds of imputation credits
The Government flagged that the refunding of imputation credits would be one aspect of business tax reform. Following the Review of Business Tax, the Government legislated to refund excess imputation credits for dividends received after 1 July 2000.
As a result, company income received by resident individuals is taxed at shareholder marginal tax rates. Excess imputation credits are refundable. This is of particular benefit to part pensioners and self-funded retirees who may pay little or no tax. In the past, as imputation credits could only be used to offset a tax liability, imputation credits were sometimes 'wasted'.
ATO data indicate that the refunding of imputation credits provided a benefit to taxpayers of around $540 million in 2000-01, of which around $350 million (or approximately two-thirds of the total benefit) went to those above age 55.8
The abolition of Financial Institutions Duty and stamp duty on marketable securities
The abolition of FID from 1 July 2001 is of benefit to those older Australians who were subject to this duty when depositing funds to their accounts. The abolition of stamp duty on marketable securities is of benefit to those who own securities directly and also those who own them indirectly, for example through a managed fund.
Other benefits of The New Tax System
Assistance to those outside the tax and social security systems
The GST Assistance Scheme (GAS) was introduced to assist low-income earners who identified themselves as not being able to receive compensation from either the taxation or social security systems (and were not a dependant of such a person). The GAS payment was a tax-free payment of $120.
Payments had to be lodged with Centrelink by 30 June 2002 and a total of 1 241 GAS payments were made, totalling $148 920.
Increased benefits and allowances
People receiving other social security pensions, such as the disability support pension, received the same level of increased payment as age pensioners. Newstart and other allowance payment rates were also increased by 2 per cent in addition to the normal adjustments for the CPI.
Other additional allowances, such as the pharmaceutical allowance, were also increased as part of tax reform and most rates increased by 2 per cent in addition to normal CPI adjustments. Rent assistance was increased by 8 per cent in addition to the CPI adjustments.
Impact on Australian families - a population distributional analysis
This section compares real disposable income before, and about one year after, tax reform was introduced. The approach used to examine the average distributional impact for groups in the Australian population is described in Appendix B. The analysis is based on unit record data from the ABS Survey of Income and Housing Costs.
All quintiles within each family type were found to have greater real disposable income about 12 months after the introduction of tax reform (Table 2). Real increases in disposable income ranged up to $51 per family per week in 2000-01 dollars.9 Couples were particular beneficiaries as reduced tax rates potentially applied to two earners.
The increase in real disposable income was significantly higher for couples with children and sole parents than for households without children in all quintiles except the highest income quintile.
Working families in the lower income quintiles saw greater proportional increases in their disposable incomes than those in the highest income quintiles (Table 3).
The current analysis does not include the benefits from improved childcare subsidies, nor the one-off impacts of the Aged Persons Savings Bonus and the Self-funded Retirees Supplementary Bonus.
Table 2: Real increase in average weekly disposable income(a)
by family type and quintile, 1999-0
0 and 2000-01 in 2000-01 dollars
| Quintile |
Couple without children
|
Retired pensioner couple
|
Couple with children
|
Self-funded retiree
|
Retired pensioner single
|
Single person in the labour force
|
Sole parent
|
|
$
|
$
|
$
|
$
|
$
|
$
|
$
|
|
| 1 |
16
|
20
|
36
|
21
|
13
|
11
|
36
|
| 2 |
12
|
21
|
51
|
36
|
13
|
0
|
42
|
| 3 |
8
|
21
|
37
|
39
|
12
|
3
|
46
|
| 4 |
15
|
27
|
41
|
30
|
13
|
12
|
40
|
| 5 |
34
|
49
|
32
|
32
|
22
|
27
|
34
|
(a) Records with the bottom 10 per cent of disposable income were excluded following ABS practice as the ABS has 'concerns with the fact that the extremely low incomes (close to nil or negative) recorded for some households in this group do not accurately reflect family living standards' (ABS, 2002).
Source: STINMOD and Treasury calculations.
Table 3: Proportional increase in real average weekly disposable income(a) by family type and quintile, 1999-00 and 2000-01
| Quintile |
Couple without children
|
Retired pensioner couple
|
Couple with children
|
Self-funded retiree
|
Retired pensioner single
|
Single person in the labour force
|
Sole parent
|
|
%
|
%
|
%
|
%
|
%
|
%
|
%
|
|
| 1 |
4
|
7
|
8
|
5
|
7
|
5
|
13
|
| 2 |
2
|
7
|
8
|
6
|
7
|
0
|
12
|
| 3 |
1
|
6
|
4
|
5
|
6
|
1
|
11
|
| 4 |
1
|
6
|
4
|
3
|
6
|
2
|
8
|
| 5 |
2
|
10
|
2
|
2
|
7
|
3
|
4
|
(a) Records with the bottom 10 per cent of disposable income were excluded following ABS practice as the ABS has 'concerns with the fact that the extremely low incomes (close to nil or negative) recorded for some households in this group do not accurately reflect family living standards' (ABS, 2002).
Source: STINMOD and Treasury calculations.
Implementation of tax reform
Benefits for business
The reform of indirect taxation enabled the abolition of the WST. Prior to tax reform WST was a 'hidden tax' applied at a number of rates, up to 45 per cent, to a narrow range of goods, creating distortions and inefficiencies within the tax system. The multiple rates also led to confusion for some, while providing evasion opportunities for businesses with more complex distribution chains.
The WST became embedded in the cost of goods and services. Further, more than half the money raised from the WST came from taxing business inputs. As a result, the WST reduced the competitiveness of Australia's exports and import competing goods.10
As its name suggests, the GST is a tax on the consumption of most goods and services in Australia, including those that are imported. As it has a broader base and involves more taxpayers, it has an overall higher direct cost of administration and compliance than the former tax system. For many businesses, cashflow benefits largely offset this higher cost. The single rate reduces compliance costs for businesses that faced multiple rates under the WST.
However, the GST does not apply to exports of goods or to services consumed outside Australia. Unlike the WST, businesses registered for the GST are able to claim input tax credits for GST paid on inputs used to make taxable and GST-free sales. The effect is to reduce the after tax cost of exports. It also reduces the price of investment goods.
The States and Territories receive all GST revenue, so tax reform also enabled them to eliminate some inefficient indirect taxes. For example, bed taxes were abolished from 1 July 2000, and FID and stamp duty on marketable securities were abolished from 1 July 2001.11
Another benefit of tax reform was the introduction of Pay As You Go (PAYG). PAYG replaced 11 tax payment systems with a single system that improves reporting requirements by allowing most businesses to use only one reporting form and to make one payment each quarter, therefore reducing the number of times that business must interact with the ATO.
These reforms delivered substantial benefits to Australian businesses through reductions in after-tax industry costs.
Compliance with the tax system
Some critics claimed that the introduction of a GST would increase the incentive to evade tax. However, the combined features of the various TNTS measures have made it more difficult for businesses to avoid their tax obligations.
Some of the measures that are forcing previously non tax-compliant businesses into the tax system are the need for an ABN and the withholding of tax in the absence of an ABN,12 the need for a tax invoice, real time reporting of business data on Business Activity Statements (BAS) and a significantly increased field presence for the ATO.
The ATO also expects to expand its cash economy programme over 2003, including contacting around 85 000 businesses that have been identified as being in industries considered at 'high risk' of being involved in the cash economy.13
The integrity measures provided by TNTS enable better data matching by cross-referencing information provided for GST purposes with that provided for income tax purposes. For example, the ATO has been able to detect ABN registrants who have not lodged income tax returns.14
Collections of GST revenue have been broadly in line with original estimates. GST revenue collections for 2001-02 were $26.9 billion15 and for 2002-03 are estimated to be $29.6 billion.16
The ATO's audit programme also has resulted in a net additional $363 million GST being paid, comprising both increased assessments and reduced assessments.17 Furthermore, ATO compliance programmes have identified incorrect and even fraudulent claims for refunds resulting in $101 million in claims being disallowed, 5 prosecutions for fraud, and a further 38 cases of suspected fraud referred to law enforcement agencies.18
The number of enterprises that applied for an ABN and registered for GST exceeded expectations. It was estimated that 1.4 million enterprises would register for GST purposes by 1 July 2000, with 200 000 additional registrants expected the following year.19 However, some 3.7 million enterprises have applied for and obtained an ABN,20 and of these, over 2.2 million have also registered for GST.21
Measures to ameliorate transitional and on-going costs to business
The Government recognised that businesses would face some implementation and on-going costs associated with TNTS. It was also acknowledged that the level of compliance costs faced by businesses would vary between different industries and depend on whether businesses had in place good accounting and record keeping practices.
The Government adopted a two pronged approach to help minimise the administrative burden placed on business through the transition to TNTS: an extensive education and assistance campaign; and a carefully designed administrative system. Consultation was an important and integral element in both of these strategies.
Education and assistance
A comprehensive education and assistance programme was implemented to help ensure a smooth transition into TNTS. This broad programme assisted businesses, consumers, and the general community adapt to the significant changes in the way businesses would interact with their customers and the tax system.
In particular, the Government was concerned about the impact of the transition to TNTS on enterprises that would be brought into the taxation system for the first time, particularly in the education and charitable sectors, and enterprises with less sophisticated accounting systems. There was also an awareness that changes to the GST base from the original proposal (as a result of negotiations by the Government to ensure the full tax reform package was implemented) had made the tax system more complex than originally intended.
Targeted consultation helped determine the education and assistance initiatives to be delivered. The Government established a New Tax System Advisory Board to monitor overall implementation. This body comprised representatives of business, education and the charitable sector. In addition, the Government drew on the advice of the Small Business Consultative Committee to ensure that the assistance was delivered in the most effective way. The Committee undertook extensive consultation with representatives of small and medium businesses.
The Government set aside $500 million to assist small and medium enterprises, community organisations and education bodies prepare for the GST. The GST Start-Up Assistance Office (GSTSAO) was established within the Treasury portfolio to administer the delivery of the $500 million assistance programme. Many of the initiatives developed within the assistance programme were delivered by industry organisations.
The $200 Direct Assistance Certificate (DAC) was developed as part of this programme to assist eligible small and medium enterprises, community sector organisations and educational bodies in preparing for TNTS. DACs were vouchers that could be redeemed by businesses (those with an expected annual turnover of less than $10 million, registered by 31 May 2000) at registered suppliers to assist with the cost of purchasing GST related products and services. Over 1.9 million DA
Cs were issued by the GSTSAO.22
Other initiatives that formed part of the assistance programme included the GST Assist call centre, the GST Start-up Assistance and GST Assist web sites, the delivery of over 22 000 seminars and workshops and the production of over 30 publications in 24 languages.
The ATO also delivered an extensive awareness, information, education and compliance programme. The ATO delivered 5 200 speaking requests, seminars and workshops and some 170 million publications were distributed. The ATO also set up a comprehensive tax reform web site that has recorded over 286 million hits and the telephone hotlines received around 8.2 million GST related phone calls. Free advisory visits by ATO field officers were available to businesses to assist with the implementation of TNTS, and over 440 000 of these visits were conducted. Furthermore, by the end of June 2002 the ATO had received and actioned over 143 000 written requests for GST technical advice.23 The ATO also set up 19 ongoing Industry Groups to work with industries to resolve and assist with implementation issues.24
The Government also provided additional assistance for charities and implemented a series of initiatives to assist the book industry.
Design features
The Government and ATO recognised the GST compliance concerns of small business.
Businesses are only required to register for GST if their turnover exceeds $50 000 per annum (or $100 000 for non-profit bodies). The registration threshold was introduced to achieve a balance between including all businesses in the GST net and minimising compliance costs for very small businesses.
In addition, small businesses with an annual turnover of less than $1 million could choose to account for transactions on a cash basis. This option recognises that some small businesses account for payments and sales at the time of payment, rather than at the time of issue or receipt of an invoice. In deciding on the $1 million threshold, it was necessary to achieve a balance between the need for consistent treatment across businesses and avoiding excessive compliance costs for small businesses.
In addition, immediate tax deductibility was provided for small and medium sized businesses for GST related expenditure incurred prior to 1 July 2000. Another transitional measure enabled businesses to claim a credit for stock-on-hand on which WST had been paid.
Changes to the GST base to extend GST-free treatment to a number of items increased the complexity of TNTS from the Government's original policy proposal - particularly for small retailers with simple accounting systems. This is because extending the GST-free treatment to basic food and other items increased the number of businesses making both taxable and GST-free sales.
As a result, the ATO developed three simplified accounting options for those small food retailers (such as bakeries, milk bars and convenience stores) that could demonstrate that they make both taxable and GST-free sales but do not have adequate point of sale equipment to identify and record this mix of sales. These simplified accounting options, (which allow eligible small businesses to estimate their GST-free sales for the purpose of calculating GST payable or GST refunds), were developed in consultation with industry representatives and the business community.
Following extensive consultation, further refinements to the GST payment and reporting arrangements were announced by the Government in February 2001.25 These changes were designed to significantly reduce the costs some businesses face in complying with the GST and the Business Activity Statement (BAS) requirements.
From the thirdBAS (due April 2001), businesses with an annual turnover of less than $20 million could choose to make their quarterly GST payments on the basis of a simple remittance form, showing only total sales, GST collected on sales and GST paid on purchases. In addition, businesses with a turnover of $2 million or less were given the option to pay quarterly GST instalments based on 25 per cent of the previous year's net GST amount, adjusted by a GDP factor.
In each of these cases, an annual report containing more detailed information is also required, on which adjustments to payments may result.
Furthermore, an option of submitting only two GST instalments each year was introduced for primary producers and certain professionals who face income fluctuations due to the seasonal nature of their business.
However, businesses were not obliged to change their reporting arrangements and were entitled to choose to continue with reporting GST on their BAS using the existing methods. A large majority of businesses chose to retain the original arrangements.
Business experience
While the Government made refinements to GST and BAS reporting arrangements in February 2001 in response to concerns of business groups and tax professionals, ATO research indicates that 90 per cent of businesses that submitted quarterly returns had chosen, as at February 2003, to stay with the full calculation and reporting of GST.26
The December 2001 Dun and Bradstreet National Business Expectations Survey revealed that by the end of 2001 businesses were finding the BAS increasingly easier to complete.27 Specifically, 76 per cent of executives found it easier to complete the simplified BAS form,28 for businesses that report and pay their GST on a quarterly basis.29
Surveys suggest that as businesses have become more familiar with the new system, compliance costs have eased as expected. The November 2001 Dun and Bradstreet National Business Expectations Survey found that more than 90 per cent of executives said they were 'comfortable' with the new tax system after 16 months and that the amount of time companies are spending on GST administration has fallen.30 This sentiment is also found in the survey results of the Yellow Pages Business Index - Small & Medium Enterprises where only 6 per cent of respondents cited the GST as a concern in the May 2002 survey.31
Even so, the Government and ATO are maintaining an active improvement programme to achieve further streamlining of taxation compliance requirements.
Bankruptcies
A number of groups raised concerns that the Government's tax reform package would result in an increase in the number of bankruptcies. However, from March 2000 to December 2000, which included the first 6 months of GST, the number of bankruptcies per quarter was the lowest it had been since the October to December 1996 quarter. Bankruptcies increased from January to June 2001. However, since June 2001 bankruptcies have fallen each quarter (Chart 10).
The Insolvency and Trustee Service Australia (ITSA) receives notifications of all bankruptcies and keeps records of the principal reason for bankruptcy. For the period from January to June 2001 ITSA noted that the GST was mentioned as the cause of bankruptcy in less than 0.3 per cent of total cases.32
Chart 10: Bankruptcies (by quarter)
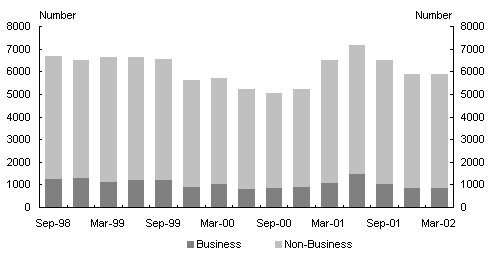
Source: Data compiled from Insolvency and Trustee Service Australia Quarterly Bankruptcy Statistics, Administrations under the Bankruptcy Act 1996 - Statistics, (Provisional), October 1998 - April 2002.
Impact of the tax reform - over two years on
The TNTS measures have had a profound impact on the structure of the tax system and the way in which businesses and consumers interact with that system.
Despite the broad and comprehensive nature of the reforms, it appears that the transitional impacts of TNTS have now largely washed through the economic system. By international standards, Australia's experience with the introduction of a broadly based consumption tax has been relatively smooth. Indications are that Australians are adapting to the new system, with business surveys mentioning the GST or other elements of TNTS less frequently as a factor affecting the business environment.
The implementation of well designed reform at a time of relatively strong economic fundamentals, complemented by appropriate compensation and a comprehensive education and assistance programme before, during and after the tax changes, as well as the concerted efforts of business, appear to have combined to help smooth the transition.
Contrary to the predictions of some critics, the evidence to date is that the impact of the tax changes on the macroeconomy, individuals and revenue has been broadly in line with expectations. However, the new system is still in its infancy and the full effects of reforms (such as the increased incentives for exporters from the abolition of the WST) are yet to be realised.
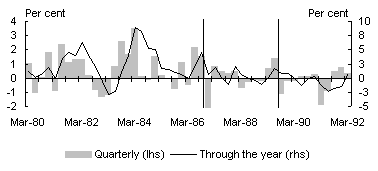
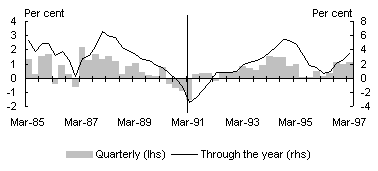
Appendix A: The experience of Canada, Japan, New Zealand and Singapore
Various countries have undertaken taxation reforms, broadly similar to those of TNTS. This Appendix contains a brief discussion of the experience of four other such countries - Japan, Canada, New Zealand and Singapore. While an international perspective can provide a useful point of comparison, caution should be exercised when drawing specific conclusions as to the implications of overseas experience for Australia. With no two economies or tax reforms exactly alike, and circumstances in which reforms are undertaken likely to differ markedly,33 it is hardly surprising that international experience varies widely between countries.
This Appendix is divided into two sections; the first section briefly describes the nature and economic circumstances surrounding the implementation of taxation reforms in the aforementioned four countries while the second section discusses some of the short-term macroeconomic effects of tax reform. Where data are available, charts are constructed to depict quarterly and through-the-year changes for some of the key economic variables for five years on either side of the date of implementation of the tax reforms.
The nature of tax reform
Canada
Changes to the Canadian taxation system were phased in from 1988-1991. Personal and corporate tax changes became effective in 1998. These changes involved broadening the tax base and lowering tax rates, and were designed to shift part of the tax burden from personal taxation to corporate taxation.
A broad-based GST was introduced on 1 January 1991 at a rate of 7 per cent. It replaced the federal manufacturers' sales tax (MST) which was a single stage tax on selected manufactured goods. Exemptions from the MST included food, clothing, prescription drugs, footwear, electricity and heating fuels. A significant proportion of revenue from this tax was collected in respect of business inputs.
A feature of the Canadian taxation system is that provincial sales taxes are also levied, primarily on goods. The replacement of the MST with the GST, combined with other changes to the tax system, such as the introduction of a high income tax surtax and a large corporation tax, was revenue neutral.
The GST was applied to the sale of new residential housing, but a system of rebates was introduced to reduce the impact of the tax on lower-priced homes. Charities and substantially government funded non-profit organisations were eligible for a special 50 per cent rebate. Municipalities, universities, schools and hospitals were also eligible for a rebate to ensure that their overall sales tax burden was unchanged with the tax reform.
Basic groceries, drugs sold by prescription, a variety of medical devices and exports were zero-rated (GST-free). Goods and services that were exempt from the GST (input-taxed) were residential rents, housing and apartment re-sales, health services, educational services, financial services, day-care and legal aid.
The Canadian economy was in recession at the time the GST was introduced.
Japan
A comprehensive taxation reform package was introduced in Japan in April 1989. The major objective of the package was to broaden the tax base and lower the rates of personal income tax. A 3 per cent general consumption tax was introduced with effect from April 1989, replacing existing selective excise taxes. The consumption tax was introduced with very limited exceptions such as medical, educational and social welfare services.
There were major reductions in both (national) personal income tax and local inhabitant tax through lowering and simplifying rates, and introducing a higher ceiling for tax-exempt income. The changes included the lowering of the basic corporate tax rate, a reduction of inheritance tax, and the taxation of capital gains earned by individuals from securities transactions. Overall, the package resulted in a net cost to revenue. The GST was increased to 5 per cent in April 1997.
At the time of the introduction of the package, Japan was growing strongly - at an annual rate of around 5 per cent led by strong consumption growth - and unemployment was falling - reaching a level of 2.3 per cent in 1989. This period of very strong economic growth was the height of what turned out to be an asset-price 'bubble', which subsequently burst, with severe effects for the Japanese economy.
New Zealand
A taxation and transfer reform package was introduced in New Zealand on 1 October 1986. A 10 per cent GST replaced most indirect taxes, including a wholesale sales tax (WST) which was levied at rates between 10 and 50 per cent. Major exemptions from the GST were exports, rent and private board, financial services, sales of second-hand goods and fundraising activities. Selective taxes were retained for fuel, alcoholic beverages, tobacco products and gaming, on top of which the GST was levied. The rates on these taxes were adjusted downwards to take account of the GST.
Extensive transitional arrangements were developed to facilitate the switch from the WST to the GST. One such arrangement was the lowering of all WST rates to a maximum of 20 per cent from 1 March 1986. It has been suggested34 that this acted to smooth the impact on sales and mitigated stock problems - although the incentive to defer consumption on goods where the tax rate was being lowered remained, the transitional measure had the effect of 'staging' the price change and thus the response of consumers and businesses alike.
On the personal income tax front, there was a move from a 5-step personal tax rate scale to a 3-step scale with a lowering and extension of the first tax rate and a substantial lowering of the top marginal rate. Compensation for the impact of the introduction of the GST on prices was provided through the benefit system with all basic benefits increased by 5 per cent. There were also changes to family support provisions designed to lower effective marginal tax rates. The rate of GST was increased to 12.5 per cent in July 1989.
When the GST was introduced in New Zealand, economic growth was weak and uneven,
the inflation rate was above 10 per cent and monetary policy had to be tightened to contain inflationary pressures. There were also significant reforms that preceded the introduction of the GST such as the abolition of wage and price controls in 1984 and the floating of the (NZ) dollar in 1985.
Singapore
A GST was first introduced on 1 April 1994 at a single low rate of 3 per cent, as part of Government's efforts to broaden Singapore's tax base and reduce reliance on direct taxes. The tax is applied across-the-board on all goods and services with very few exemptions. The only exemptions are financial services and the sale or lease of residential properties, which are exempt (input-taxed) supplies.
At the time of introduction, the Government committed to not raising the rate as long as it did not need more revenue. It introduced several offsetting measures to assist Singaporeans to adjust to the new regime. These measures included: a) a cut in corporate and personal income tax rates, an increase in personal relief and a tax rebate; b) rebates for owner-occupied residential properties; c) removal of taxes on domestic telephone bills and entertainment duty; d) a cut in public utility and transport taxes and charges; e) a cut in import duties for cars and diesel and petrol duties; f) rebates on service and conservancy charges for 3-room and smaller Housing Development Board (HDB) flats, and rentals for 1 and 2-room HDB flats; g) an increase in the 'Edusave' education grant; h) an increase in public assistance; i) an increase in Singapore Allowance for pensioners; and j) an annual grant of $3 million to citizens' consultative committees to help the needy.
Following the lowering of corporate and personal income taxes in the 2002 Budget, the Minister of Finance also announced that the GST rate would be raised from 3 to 5 per cent with effect from 1 January 2003, to make up at least part of the revenue losses from income tax reductions.
At the time the GST was introduced in 1994, economic activity in Singapore was quite buoyant. The recently announced increase in the GST rate came at a time when Singapore was just emerging from a sharp economic contraction.
Macroeconomic impacts of tax reform
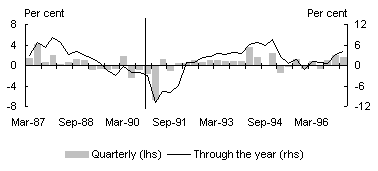
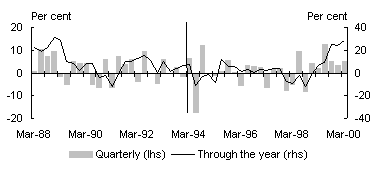
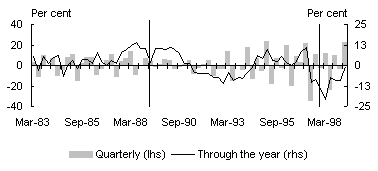
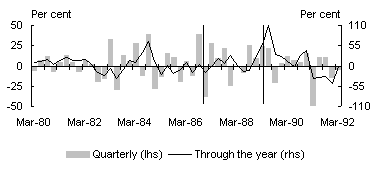
The international experience (Chart A1) indicates that a temporary slowdown in GDP growth occurred in each of the four countries under consideration, following the introduction of major tax reform packages. The quarterly decline was most pronounced in New Zealand and Canada, although these countries were experiencing a period of weakness in economic activity prior to the implementation of tax reform. In Japan and Singapore, however, GDP growth rebounded quickly and strongly.
Chart A1: GDP growth - international
Japan

GST introduced April 1989 and rate raised April 1997.
New Zealand
GST introduced October 1986 and rate raised July 1989.
Canada
GST introduced January 1991.
Singapore
GST introduced April 1994.
The international experience in relation to residential construction (Chart A2) is somewhat mixed, but in all cases considerably less volatile than the Australian experience. New Zealand experienced some bring-forward of construction ahead of the introduction of its tax reform package, and a consequent sharp, but short-lived, slowing in activity immediately afterwards.
Chart A2: Residential construction - international
Source: CEIC database, Datastream and NZ time Series.
For both Canada and Japan,35 it is difficult to discern any impact on residential construction associated with the introduction of indirect taxation reforms. In both cases, this is most likely a reflection of the general economic conditions at those times. In Japan, residential construction activity was already strong because of buoyant economic conditions, limiting the extent to which any bring forward in housing construction was possible. The converse holds for Canada where the economy was generally weak at the time the reforms were implemented and residential construction had already been declining for a number of quarters.
In terms of private (household) consumption expenditure, with the exception of Canada (again most likely reflecting the state of the economy at the time), there was a significant bring forward of consumption expenditure prior to the implementation of the tax reforms followed by a significant unwinding immediately following implementation (Chart A3).
Chart A3: Private consumption expenditure - international
Japan
GST introduced April 1989 and rate raised April 1997.
New Zealand
GST introduced October 1986 and rate raised July 1989.
Canada
GST introduced January 1991.
Singapore
GST introduced April 1994.
With respect to retail trade, the experience of New Zealand, Singapore and Japan was similar to that of Australia (Chart A4). In Canada, the apparent absence of a major bring-forward of expenditure might be largely due to weak economic conditions at the time when its tax reform was introduced.
Similar to the Australian experience, motor vehicle purchases in Canada declined prior to the taxation reforms and then increased following the introduction of its GST (Chart A5). This increase may be partly attributable to the lower GST rate (of 7 per cent) compared with the manufacturing sales tax rate (of 13.5 per cent) which it replaced. It should also be noted that this increase followed four quarters of negative quarterly growth and almost three years of depressed growth in motor vehicles purchases. Hence, given the very weak economic conditions in Canada at that time, it is difficult to isolate a specific 'GST-effect' from the broader economic circumstances. In contrast, there does not appear to have been a deferral of motor vehicle purchases ahead of the i
mplementation of the tax changes in New Zealand, Singapore or Japan. This may reflect the different effect of taxation reform on motor vehicle prices in these countries.36
Internationally, a distinct once-off increase in the CPI is observable in the four countries under consideration - most obviously in the case of New Zealand and barely discernible in the case of Singapore (Chart A6). In each of these countries, the trend rate of inflation did not accelerate following the implementation of the taxation reforms.
In summary, this brief review of the short-term macroeconomic impacts of the introduction of the GST in the four countries considered shows some significant variation. This may be largely attributed to the different stages of the economic cycle when GST was introduced. In particular, Japan was at the height of a 'bubble', while Canada was in recession. Economic conditions were buoyant in Singapore while economic activity in New Zealand was weak and uneven. Other factors likely to have contributed to the divergent experiences include differences in the rate of the GST applied and the mix of taxes it replaced, along with the nature of any compensation package which accompanied the tax reform process.
Chart A4: Retail trade - international
Japan
GST introduced April 1989 and rate raised April 1997.
New Zealand
GST introduced October 1986 and rate raised July 1989.
Canada
GST introduced January 1991.
Singapore
GST introduced April 1994.
Chart A5: Motor vehicles - international
Japan
GST introduced April 1989 and rate raised April 1997.
New Zealand
GST introduced October 1986 and rate raised July 1989.
Canada
GST introduced January 1991.
Singapore
GST introduced April 1994.
Chart A6: Inflation - international
Japan
GST introduced April 1989 and rate raised April 1997.
New Zealand
GST introduced October 1986 and rate raised July 1989.
Canada
GST introduced January 1991.
Singapore
GST introduced April 1994.
Appendix B: Approach taken for distributional analysis
To determine the distributional impact of tax reform, real disposable income was compared before and about one year after tax reform was introduced. This was undertaken for a number of family types divided into disposable income quintiles:
- couples with children;
- sole parents;
- retired pensioner couples;
- retired pensioner singles;
- self-funded retirees;
- couples without children of working age; and
- singles in the labour force.
The family type description was defined according to the characteristics of the head of the household, as defined by the ABS in its income surveys. Retirees were defined as being at least 55 years of age and not in the labour force. Self-funded retirees37 were defined as singles with disposable income greater than $400 per week and couples with combined disposable income greater than $600 per week at June 2000. Singles of working age were defined as adults aged greater than 24 years (the aged limit of parental income testing for Centrelink payments) who were either working or seeking work while on Newstart Allowance.
The number of families in each family type and disposable income ranges for each quintile is also provided in Tables B1 and B2 below.
STINMOD, a microsimulation model of taxes and benefits was used to determine nominal disposable income before and after tax reform.38
The results from STINMOD were subsequently adjusted to compare real disposable income before and after tax reform. This took into account the 6.0 per cent increase in the CPI between the June quarters of 1999-2000 and 2000-01.
Table B1: Number of families(a) by family type and disposable income quintile, 2000-01
|
Couple without children
|
Retired pensioner couple
|
Couple with children
|
Self-funded retiree
|
Retired pensioner single
|
Single person in the labour force
|
Sole parent
|
|
1,111,000
|
631,000
|
1,701,000
|
128,000
|
938,000
|
1,327,000
|
477,000
|
(a) Records with the bottom 10 per cent of disposable income were excluded following ABS practice as the ABS has 'concerns with the fact that the extremely low incomes (close to nil or negative) recorded for some households in this group do not accurately reflect
family living standards' (ABS, 2002).
Source: STINMOD and Treasury calculations.
Table B2: Average weekly nominal disposable income(a) by family type and disposable income quintile, 2000-01
| Quintile |
Couple without children
|
Retired pensioner couple
|
Couple with children
|
Self-funded retiree
|
Retired pensioner single
|
Single person in the labour force
|
Sole parent
|
|
$
|
$
|
$
|
$
|
$
|
$
|
$
|
|
| 1 |
420
|
339
|
521
|
500
|
209
|
261
|
333
|
| 2 |
687
|
352
|
742
|
667
|
210
|
440
|
402
|
| 3 |
927
|
381
|
915
|
812
|
211
|
550
|
488
|
| 4 |
1,162
|
469
|
1,146
|
998
|
242
|
673
|
594
|
| 5 |
1,785
|
595
|
1,752
|
1,939
|
336
|
930
|
855
|
(a) Records with the bottom 10 per cent of disposable income were excluded following ABS practice as the ABS has 'concerns with the fact that the extremely low incomes (close to nil or negative) recorded for some households in this group do not accurately reflect family living standards' (ABS, 2002).
Source: STINMOD and Treasury calculations.
References
Attorney General for Australia (2001) GST Has Little Impact on New Bankruptcies, Media Release, 18 September 2001.
Australian Bureau of Statistics (ABS) (2002), Measuring Australia's Progress, Catalogue Number 1370.0, Australian Bureau of Statistics, Canberra.
-- (2003), National Accounts: National Income, Expenditure and Product, Catalogue Number 5206.0, Australian Bureau of Statistics, Canberra.
-- (2003), The Labour Force, Preliminary, Catalogue Number 6202.0, Australian Bureau of Statistics, Canberra.
-- (2003), Consumer Price Index, Catalogue Number 6401.0, Australian Bureau of Statistics, Canberra.
-- (2003), House Price Indexes, Catalogue Number 6416.0, Australian Bureau of Statistics, Canberra.
-- (2003), Retail Trade, Catalogue Number 8501.0, Australian Bureau of Statistics, Canberra.
-- (2003), Sales of New Motor Vehicles, Catalogue Number 9314.0, Australian Bureau of Statistics, Canberra.
Australian Taxation Office. (2002), Cash Economy Task Force Working Paper - Future Strategies October 2002.
-- (2002) Compliance Program 2002-03.
-- (2002a) Compliance Program 2002-03.
Commonwealth of Australia (1998) Tax Reform: not a new tax, a new tax system, AGPS, Canberra.
-- (2000) Budget Strategy and Outlook 2000-01, AGPS, Canberra.
-- (2000) Mid-Year Economic and Fiscal Outlook 2000-01, AGPS, Canberra.
-- (2002) Final Budget Outcome 2001-02, AGPS, Canberra.
-- (2002) Mid-Year Economic and Fiscal Outlook 2002-03, AGPS, Canberra.
-- (2001) Treasury Annual Report 2000-2001, AGPS, Canberra.
Commonwealth Minister for Industry, Tourism and Resources (2002) Early Closure of Book Printing Schemes - Federal Budget 2002, 14 May 2002.
Commonwealth Treasurer (2001), Streamlined GST and PAYG Reporting, Press Release No. 007, 22 February 2001.
Dun and Bradstreet (2001), The New Monthly D&B Business Expectations Survey - December 2001, 18 December 2001.
Dun and Bradstreet (2002), The New Monthly D&B Business Expectations Survey - January 2002, 15 January 2002.
Insolvency and Trustee Services Australia Administrations under the Bankruptcy Act 1996 - Statistics (Provisional) Bankruptcy Statistics, October 1998-April 2002.
Melbourne Institute of Applied Economic and Social Research (2003), Melbourne Institute Consumer Inflationary Expectations, University of Melbourne, Melbourne.
Regulation Impact Statement for the Introduction of a Goods and Services Tax. 1998, Cat. No. 9837341, AGPS, Canberra.
Singapore Department of Statistics, Impact of the Introduction of the Goods and Services Tax on Retail Trade, Singapore, December 1994.
Stephens, R. (1993) 'Radical tax reform in New Zealand', Fiscal Studies 14(3), August.
Yellow Pages (2002), Yellow Pages Business Index - Small & Medium Enterprises, May 2002.
- For discussion of the expected long-run effects see Commonwealth of Australia (1998), Tax Reform: not a new tax, a new tax system, pp. 155-157.
- As a share of GDP in the June quarter 2000.
- See House Price Indexes, ABS Cat. No. 6416.0.
- Detailed information and discussion regarding the outcomes of the PRISMOD modelling of the TNTS package can be found in Commonwealth of Australia (1998), op cit.
- Again, this was consistent with the Budget forecast
s, taking into account the move by the ABS to the 14th series CPI, which had the effect of lowering the original estimated prices impact of the TNTS package (of 2¾ per cent through the year to the June quarter 2001) by ¼ of a percentage point. - The rate at which benefits are reduced as a recipient's income increases.
- ABS, Consumer Price Index, Australia Cat. 6401.0.
- Data based on tax returns processed by the ATO to mid-June 2002.
- There was not a clear monotonic (that is, steadily increasing) pattern of higher nominal differences for higher quintiles within each family type. This is due firstly, to compositional differences between the quintiles (such as, the age and number of children, the number of earners, and ratio of government benefits to private income). Secondly, compensation was delivered through the tax-benefit system, which, partly due to the interactions between taxes and benefits, did not provide for monotonic increases (Tax Reform: not a new tax, a new tax system, 1998, Chapter 5). There was little difference between quintiles one to four for retired single pensioners due to relatively little difference in average incomes between the quintiles (see Appendix B).
- For further discussion on the WST see Commonwealth of Australia (1998) op cit, pp. 71-72.
- Subject to review by the Ministerial Council on Commonwealth State Financial Relations, debits tax is to be abolished by 1 July 2005. (NSW has abolished debits tax from 1 January 2002.) The Ministerial Council will also review, by 2005, the need for the retention of a range of business stamp duties.
- A key feature of tax reform was the introduction of the ABN. Where a business is supplied with goods or services and a supplier does not quote its ABN, then under TNTS businesses must withhold tax at the rate of 48.5 per cent. According to ATO data, around $70 million has been withheld from payments to businesses not quoting their ABN since 1 July 2000. Furthermore, around 30 per cent of this amount has not been claimed back. Australian Taxation Office (2002) Compliance Program 2002-03, p. 20.
- Australian Taxation Office (2002a) Compliance Program 2002-03, p. 20.
- Ibid.
- Commonwealth of Australia (2002), Final Budget Outcome 2001-02, p. 42.
- Commonwealth of Australia (2002), Mid-Year Economic and Fiscal Outlook 2002-03, p. 157.
- Australian Taxation Office (2002a) op cit, p. 22.
- Ibid.
- Regulation Impact Statement for the Introduction of a Goods and Services Tax (1998), p. 5.
- Data provided by the Australian Taxation Office, 25 June 2002.
- Australian Taxation Office (2002a) op cit p. 22.
- Commonwealth of Australia (2001) Treasury Annual Report 2000-2001, p. 52.
- Data provided by the Australian Taxation Office, 10 July 2002.
- Data provided by the Australian Taxation Office, 10 July 2002.
- Commonwealth Treasurer (2001), Streamlined GST and PAYG Reporting, Press Release No. 007, 22 February 2001.
- Data based on tax returns processed by the ATO as at February 2003. Of the remaining 10 per cent, 6 per cent chose the option of paying GST instalments and making an annual return, while 4 per cent chose another simplified option.
- Dun and Bradstreet (2001) The New Monthly D&B Business Expectations Survey - January 2002, 15 January 2002.
- The simple remittance form for businesses that report and pay quarterly. For further detail see Commonwealth Treasurer, (2001), Streamlined GST and PAYG Reporting, Press Release No. 007, 22 February 2001.
- Dun and Bradstreet (2001) ibid.
- Dun and Bradstreet (2001a) The New Monthly D&B Business Expectations Survey - December 2001, 18 December 2001.
- Yellow Pages (2002) Yellow Pages Business Index - Small & Medium Enterprises, May 2002, p. 11.
- Attorney-General for Australia (2001) GST Has Little Impact on New Bankruptcies, Media Release, 18 September 2001.
- In terms of, for example, the stage of the economic cycle at introduction, differences in the rate of GST and the magnitude and mix of taxes that it replaced as well as the nature and extent of any compensation package provided.
- See, for example, Stephens (1993).
- Residential building approvals followed a similar pattern in Singapore, although the analysis is hampered by limited data availability.
- In Singapore, the introduction of the GST on motor vehicles was partly offset by a reduction in import duties (from 45 to 41 per cent) and motor vehicle sales were more likely influenced by the number of Certificates of Entitlement (CoE) issued and the quota premium than the taxation changes. According to the Singapore Department of Statistics, from June to October 1994 business demand for motor vehicles declined largely due to the rapid increase in the tender price of the CoE (see Department of Statistics, Impact of the Introduction of the Goods and Services Tax on Retail Trade, Singapore, December 1994). In New Zealand, the 30 per cent sales tax on motor vehicles was converted to a 25 per cent excise duty (with the 10 per cent GST applying), resulting in a slight overall increase in taxation of new motor vehicles.
- Retired pensioners include families whose primary income source is a pension and retirees with low disposable incomes who are ineligible for a pension. Self-funded retirees derive their income primarily from private sources.
- STINMOD is produced by the National Centre for Social and Economic Modelling (NATSEM) located at the University of Canberra using Commonwealth funding. It is based on the ABS Survey of Income and Housing Costs, which provides information on a representative sample of Australians. The survey is updated by NATSEM to capture relevant economic and population changes since the survey was undertaken.