Paul Hubbard, Samuel Hurley and Dhruv Sharma1
Since the beginning of China's 'reform and opening up', high rates of investment spending have dramatically expanded the productive capacity of the Chinese economy, and accommodated the migration of hundreds of millions of rural agricultural labourers to the industrial and services sectors. This has underwritten a sustained boom in Chinese household consumption, even though it has declined as a share of Chinese GDP.
While unique in its magnitude, China appears to be following the same development path of Japan, Korea and Singapore. As the migration of the labour force from agriculture to urban-based industry runs its course, and as higher-income consumers demand more labour-intensive services, household incomes — and with it household consumption — is likely to stabilise as a share of GDP.
Household consumption and investment have both grown very strongly since China's initial reforms and opening up in the late 1970s. On average, however, investment has grown at a faster rate than consumption, which sees private consumption in China now making up an historically low proportion of GDP.
Against this backdrop, the Chinese authorities are committed to establishing a 'long-term mechanism for increasing consumer demand' (Xinhua, 2012) as part of a wide-ranging strategy to transition China's economy towards a more sustainable growth model as China enters the next stage of its development.
Comparing China with the development experience of other emerging and developed East and Southeast Asian economies, this article shows that a rapid fall in the consumption share of GDP is a typical part of the early stages of their economic development. In line with these previous experiences, the private consumption share of GDP tends to stabilise as per capita incomes reach 'middle income' levels.
This paper suggests that China is likely to follow a similar path over the long term. Trends in Chinese consumption are largely explained by changes in household income, which in China is predominantly labour income (Sharma & Yao, forthcoming). As China exhausts its supply of surplus labour we expect households' share of national income — and the household share of consumption — to gradually rise, even without policy intervention directed to consumers. As part of this, a labour-intensive services sector will continue to grow to meet the demands of increasingly affluent consumers.
This implies that rather than adopting measures explicitly to boost Chinese consumption directly, structural reforms that improve the allocation of labour and capital are the best ways to support household income growth, and therefore, consumption growth, in the long term.
China's Consumption and Investment Booms
In 1978, only one in five Chinese citizens lived in a city. Rural agriculture employed two thirds of the labour force, but contributed only one-third of GDP.
China's economic structure today has been radically transformed. Agriculture now employs just a third of the labour force, and accounts for around ten per cent of output. For the first time in China's history, more Chinese live in cities than in rural areas, with access to higher-productivity employment and higher wages.
Chinese real per capita household consumption expenditure increased more than 10 times over this period, growing by more than 7 per cent annually on average, much higher than any other major economy over this period.
But overall household consumption growth was slower in real terms than growth in investment, which grew more than 10 per cent per year on average since 1979 (Chart 1).
Chart 1: Investment and household consumption growth, 1979 — 2011
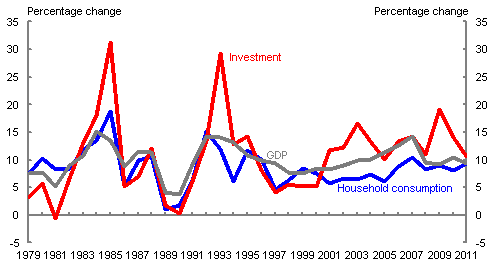
Source: World Bank Global Development Indicators
Indeed, the shift out of rural agriculture to urban industry could not have been possible without a corresponding increase in investment. That is, the strong growth in consumption depended on the investment boom, which provided greater employment opportunities and higher incomes for China's labour force, as well as the infrastructure needed to integrate China's regions into a national economy, and China's national economy into the global economy. Rapid urbanisation without high investment would have led to 'mega-slums' rather than 'mega-cities'.
Since 1978, investment has generally accounted for at least one third of China's GDP. In two periods, 1993-1995 and from 2003 to the present, investment as a proportion of GDP was above 40 per cent. Investment growth in 2009 was particularly high, as China enacted a RMB 4 trillion (equivalent to 13 per cent of GDP) stimulus package — focused on infrastructure — which helped stabilise Chinese GDP growth in response to the global financial crisis and the 2008 Sichuan Earthquake. This pushed the investment share to almost half of GDP by 2011, although investment growth has slowed substantially after stimulus was withdrawn.
'Global imbalances' and Chinese 'rebalancing'?
In the years leading up to 2001, China's high investment levels absorbed most of the country's savings, meaning that China did not initially feature in the International Monetary Fund's (IMF) concerns over 'global imbalances' (IMF, 2005). But strong growth in trade following China's accession to the World Trade Organization in late 2001 (Coates, et al., 2012), combined with strong growth in the global economy (Ma, et al., 2012, p. 72), generated huge trade surpluses for China, contributing to a peak current account surplus of 10.1 per cent of GDP in 2007.
Chart 2: China's current account balance, 1981 — 2011
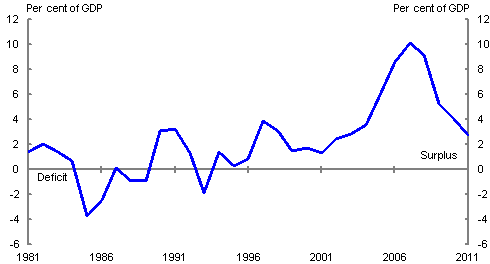
Source: IMF World Economic Outlook, October 2012
Describing the 'surging trade surplus' as 'China's main short term macro challenge', in November 2006, the World Bank started to publicly advise China that its 'key economic challenge is to rebalance the economy'. This was to be achieved through a raft of structural reforms including, but not limited to, 'a larger role for consumption instead of investment and exports' as a component of demand (World Bank, November 2006, p. 15).
This drew on the earlier work of Kuijs and Wang (2005) who had found that China's growth since the mid-1990s had come from large-scale investment in industry rather than a continuation of the previous trend of urban job creation. They attributed this to government policies — particularly in relation to energy, finance and labour — that implicitly subsidised current industrial production over services or domestic consumption.
They estimated that with 'rebalanced policies' — that is a removal of these implicit subsidies — China could still achieve 8 per cent growth through total factor productivity growth and employment growth, offsetting a decline in the investment share. These structural challenges are further explored in 'China in a new period of transition' elsewhere in this volume (Kong, et al., 2012).
The Chinese authorities have also publicly voiced their concerns. While not adopting the term 'rebalancing',2 Premier Wen Jiabao told a press conference in March 2007 that the economy was 'unstable, unbalanced, uncoordinated and unsustainable' (Xinhua, 2007). Among other causes, the Premier noted that 'China's economic growth relies too much on investment and export'. The 12th Five Year Programme for National Economic and Social Development, adopted by the National People's Congress in 2011, formally recognises that
there are 'imbalanced, incompatible and non-sustainable elements within China's development' which include 'an imbalance between investment and consumption' (National People's Congress, 2011).
As such, Chinese authorities appear to have accepted the logic that Chinese growth cannot be sustained indefinitely by export or investment growth alone. In his final address as Chinese Communist Party General Secretary, Hu Jintao called for a 'long-term mechanism for increasing consumer demand' (Xinhua, 2012).3 Consistent with their generally cautious approach to economic reform, changes are likely to be gradual.
A New Twist on the Familiar Pattern of Economic Growth
Although China's private consumption share is historically low, its development pattern is broadly in line with the Asian post-war growth experience (Kong, et al., 2012). Across developing Asia, the consumption share of GDP fell markedly during the post-war period (Chart 3). While China's household consumption share has tended to be at the lower end of the spectrum among East and Southeast Asian economies, it has not consistently been the lowest.
Over this period, the largest falls in household consumption share came from Korea and Singapore, both of which had household consumption shares of over 80 per cent of GDP until the mid-1960s. Private consumption in Korea and Singapore now accounts for 53 per cent and 39 per cent respectively of GDP. Japan, which at the start of this period already had by far the highest per capita income levels, experienced the smallest fall in consumption — followed by a rise to 60 per cent after 1990. The latter coincided with peak of Japanese investment, after which followed Japan's so-called 'lost decade'.
Chart 3: Household Consumption Shares, Asian economies, 1950 — 2011
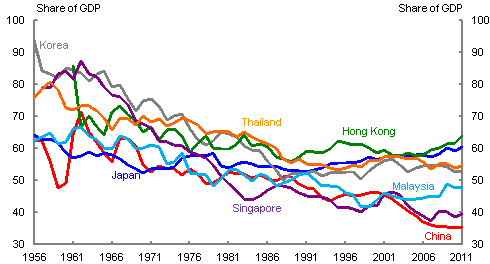
Source: IMF International Financial Statistics, author calculations
These stylised trends in aggregate consumption have become a feature of the post-war pattern of economic development experienced across much of Asia. At very low levels of per capita income — close to subsistence levels — almost all output is for consumption (Chart 3). Generally, households are only barely able to cover spending on the necessities of life, leaving little scope for domestic saving and investment. Lacking the infrastructure or the policies to take advantage of trade, the economy is primarily focused on agriculture.
As the economy begins to grow, we observe the consumption share of GDP fall precipitously — reflecting the large scale of investment needed for industrialisation and urbanisation. Household incomes rise, but as long as there is a large pool of surplus labour in the less-productive agricultural sector of the economy, wages remain very low. Capital, which at low income levels is the relatively scarce factor of production, makes high returns and so attracts even more resources for further investment. Integration into global trading networks provides an opportunity for rapid 'export-led' economic growth (Coates, et al., 2012)
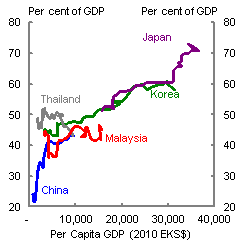
This 'high growth' dynamic comes to an end once the surplus agricultural labour is exhausted (Eichengreen, et al., 2011). After reaching the 'Lewis turning point', labour becomes scarce, so real wages are bid up (Lewis, 1955). Household income can then grow, with spending extending beyond basic goods, towards more complex products and services. We observe for Korea, Hong Kong, Japan and Singapore that consumption shares eventually level out, and can even rise over time, particularly as the demand for and cost of government social services begins to rise (Chart 4). While China, like Malaysia and Thailand, remains at an early stage of this development process, its policy challenge is particularly complex and it is faced by a rapidly aging demographic profile (see Kong, et al. (2012) for further discussion).
Chart 4: Household Consumption Shares, Asian economies, by income
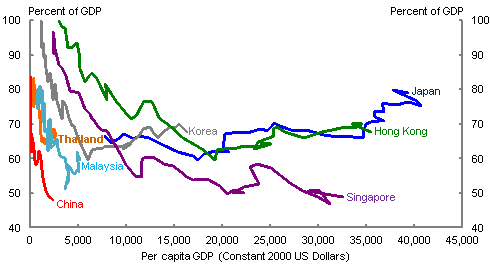
Source: IMF International Financial Statistics, author calculations (data are for 1960-2010, except for Singapore 1961-2010)
Including government consumption with private consumption shows that China's total consumption is around half of GDP, slightly below that of Singapore (Chart 5). In contrast to China's low private consumption share of GDP, government consumption has historically been amongst the highest of economies in the region. Of the countries listed, only Korea (15 per cent) and Japan (21 per cent) devoted a higher proportion of GDP to government consumption than China (14 per cent) in 2011.
Chart 5: Household and Government Consumption, Asian economies, 2011
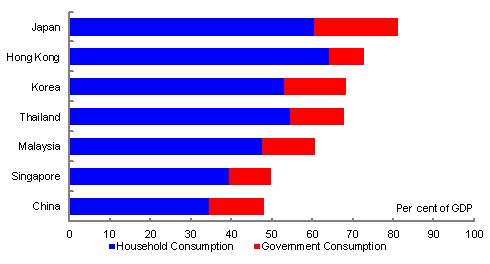
Source: IMF International Financial Statistics, author calculations.
Is China on the same path?
If China follows a similar development path to other Asian economies, then its consumption share of GDP is likely to stabilise, and probably rise, over the coming decades. The next section examines whether there are compelling reasons to think that China may not follow this stylised path, and may in some way be an 'outlier' with respect to consumption.
Ordinary Chinese consumers
In a Treasury working paper Sharma and Yao (forthcoming) model Chinese household consumption behaviour according to a standard economic consumption model. In particular, the working paper considers whether constraints on the availability of credit, due to relatively underdeveloped financial markets in China, significantly affect Chinese household consumption.
The authors find that in the long run, household consumption is explained almost entirely by household wealth, as predicted by standard consumption theory. That is, the results suggest that there is nothing unique about Chinese household consumption behaviour — given the share of national income that households receive.
The paper also considers the possible effects of credit constraints on Chinese consumers, due to the fact that China's financial markets remain at an early stage of development. Credit constraints are found to have some explanatory power for Chinese household consumption, suggesting that financial sector reform will play an important role in allowing households to better adjust to economic fluctuations. Of course, financial sector reforms would also boost future household incomes and wealth, and would therefore likely lead to higher consumption indirectly as well. The paper also finds that credit constraints and financial market sophistication influence the consumption of durables more so than non-durables.
Regional consumption trends
Supporting evidence can also be found by considering regional variations in Chinese consumption trends. Provincial data can be aggregated into four discrete 'regional' blocks — East, Northeast, Central and West, with the largest and most developed economies in the Eastern region (Chart 6).
Chart 6: Nominal expenditure-based GDP breakdown by province (2010)
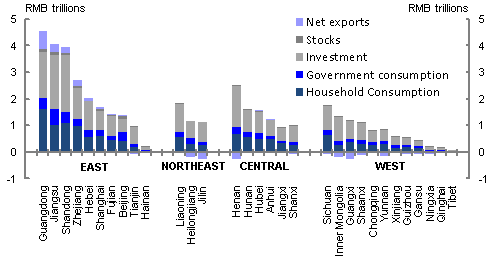
Source: Economist Intelligence Unit, 2010.
All regions have experienced a marked fall in consumption share over recent decades (Chart 7 Panel A). Since the beginning of China's 'reform and opening up', the average fall in the consumption share of GDP across China's provinces has been above 20 percentage points, with the capital, Be
ijing, and the commercial hub, Shanghai, the only places to record a rise over that time.
To date these developments have been largely in line with a falling household income share of GDP. In each of the four regions, household income as a share of GDP has fallen steadily from mid-1990s levels (Chart 7 Panel B). This has occurred despite robust growth in incomes over that time period, reflecting faster growth in other sectors and other factors which have tended to reduce labour's share of total income.
Chart 7: Shares of Gross Regional Product
Panel A: Private Consumption
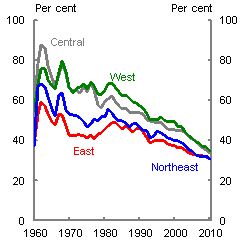
Panel B: Disposable income
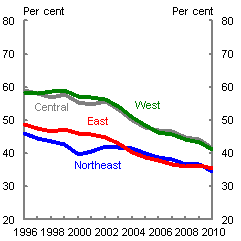
Source: Economist Intelligence Unit, author calculations.
The strength of the relationship between disposable income and consumption shares is also evident across province-level data. Chart 8 plots the consumption share of GDP for each province against its disposable income as a share of GDP for three years: 1996, 2003 and 2009. Over time, the consumption share has declined steadily and consistently across provinces, mirroring falls in the disposable income share of GDP.
Chart 8: Disposable income and consumption shares of GDP
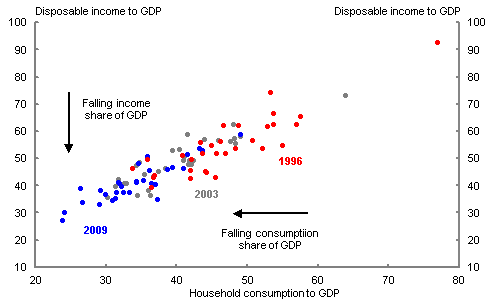
Source: Economist Intelligence Unit, author calculations.
The outlook for household incomes
The above analysis suggests that consumption in the Chinese economy is primarily driven by trends in households' share of disposal income, rather than any factors unique to Chinese consumers. This suggests that the outlook for Chinese consumption depends on the outlook for household income.
As household income in China is predominantly derived from labour, structural factors that affect the returns to labour (wages) are likely to drive changes in overall consumption. And lower returns to capital will shift income away from the corporate and state sectors that have saved and re-invested their profits (Ma, et al., 2012, p. 75), towards households, which should support greater household consumption
Indeed, there is already evidence that China is seeing the kinds of structural shifts that will bid up wages, increase the household share of income, and therefore stabilise the share of household consumption, consistent with the pattern observed elsewhere in Asia.
These shifts include the end of China's cheap, surplus pool of labour (Kong, et al., 2012), as well as the greater development of the labour-intensive services sector, in response to the evolving preferences of Chinese consumers as they become wealthier. Evidence from regional wage differentials provides further evidence of the structural shifts that are already underway.
Wage pressure in China's regions
Regional patterns of GDP and wages growth suggest that changing patterns of labour demand are already leading to more widely spread economic and income growth across China. For example, in the Eastern provinces, where nominal wages are significantly higher on average than in the rest of China, producers are already facing pressure from low-cost competitors offshore (Coates, et al., 2012).
This is being compounded by the emergence of genuine competition from lower-cost producers domestically from other regions in China, aided by rapid infrastructure and other investment as part of the Central and Western development plans and in response to the global financial crisis (National Development and Reform Commission, 2012).
Reports of labour shortages in some Eastern cities and provinces have intensified in recent years, with increasingly industrialised and well-connected urban centres in some Central and Western provinces emerging as viable locations for low-cost production.
While many of the major Eastern provinces were at the forefront of rapid real wages growth in the early part of the past decade, real wages on average grew at a slower pace in the East than in the Northeast, Centre and West between 2004 and 2007. This trend continued following the global financial crisis, with the Centre and West again outstripping the East in real wages growth in 2009. In each year since 2005, of the 10 provinces with the fastest annual pace of real wages growth, at least six have been in the Northeast, Centre or West.
Faster wages growth has resulted in a narrowing of the wages gap between the East and the interior. In nominal terms, while the difference between average per capita nominal wages between the East and other regions remains significant, the gap has narrowed significantly over the past 10 years (Chart 9)
Chart 9: Nominal per capita wages — share of East
Panel A: Centre
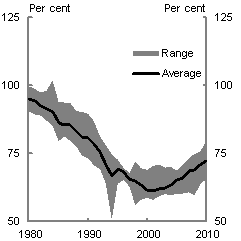
Panel B: West
Note: Charts show the range and average proportion of nominal per capita wages in Central and West regions to the average per capita nominal wage for the East. Calculations for the West exclude Qinghai and Tibet provinces.
Source: EIU and author calculations.
Rapid wage growth in increasingly developed and connected Centre and West regions implies a broadening of income growth and consumption opportunities, which will reinforce existing trends towards higher spending, including on durable goods and services.
As increasing investment and industrialisation spurs productivity growth inland, cities and provinces in the East will face growing competition for labour resources from industrial centres. Being closer to home, these emerging inland cities will be particularly attractive for much of the rural migrant workforce that has traditionally underpinned low-cost coastal production.
Higher incomes tend toward consumption of labour-intensive services
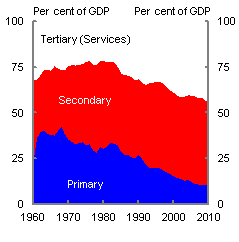
Higher wages will also affect the composition of consumption spending, with an increased share of household spending going to labour-intensive services. China's tertiary (services) sector has already expanded rapidly as a share of GDP since reforms began in the 1980s (Chart 10 Panel A).
Chart 10: Service sector growth in China and selected Asian economies
Panel A: China's GDP shares
Panel B: Service sector share
Source: CEIC China Database.
Source: World Bank World Development Indicators (Services Share), Conference Board 2010 Total Economy Database (Income).
Notes: Data are for 1960-2010A larger services share of GDP implies a progressively greater share of employment in the more labour-intensive services sector industries.
This trend reinforces the anticipated trend of a greater labour income share of GDP
— and therefore a larger share of household consumption — over time. Comparison with the development of economies such as Japan and Korea show that China is approaching income levels where the services sector share of GDP begins to expand rapidly (Chart 10, Panel B). However, there are also countries which have not yet moved beyond middle income levels, possibly partly on account of policies that inhibit the development of their domestic services sector.
The same trend can be observed in China by looking at household consumption data by income level. As a proportion of total consumption outlays, urban households with the lowest income dedicate relatively more to food, while higher income households spend relatively less on food. Correspondingly, wealthier households spend relatively more on more complex goods and services (represented in Chart 11 as a combination of spending on transport and communication and education, recreation and cultural services).
Chart 11: Average share of urban consumption expenditure, by income quartile
Panel A: Food
Panel B: Services
Source: CEIC and author calculations
Note: Services includes transport, communication, education, recreation and cultural services.
The shift in spending patterns towards progressively more complex goods and services at higher income levels has crucial implications for the structure of the Chinese economy. As incomes grow, the increased demand for services will further increase the demand for high-skilled and high-wage labour, reinforcing the trend toward higher household consumption.
This progression towards a more service-oriented economy will require appropriate policy settings. For example, the current tax system tends to penalise firms operating in the tertiary sector through double taxation, with the mooted change to a value-added system likely to be a positive development in transitioning the economy towards the service sector.
Conclusion
This paper suggests that the rapid decrease in private consumption as a share of China's GDP is not exceptional but broadly consistent with China's current stage of development. While private consumption in China over the past thirty years has increased rapidly, the growth in investment has been even more rapid.
However, on present demographic and structural trends, it is likely that market forces will see an end to this pattern as investment growth eases as the Chinese economy continues to develop. Instead, private consumption will become an increasingly important source of domestic demand and driver of economic growth in China, just as occurred in Korea, Hong Kong, Japan and Singapore before it.
References
Coates, B, Horton, D, and McNamee, L. 2012 'China: Prospects for “export-led” growth'. Economic Roundup, Issue 4.
Eichengreen, B, Park D, and Shin K. 2011'When fast growing economies slow down: International Evidence and Implications for China.' NBER Working Paper Series. NBER Working Paper 16919.
IMF 2005 September 'Global Imbalances: A Savings and Investment Perspective'. World Economy Outlook.
Kong, V, McKissack, A and Zhang, D 2012 'China in a new period of Transition' Economic Roundup (4).
Kuijs, L, and Wang, T 2005 'China's Pattern of Growth: Moving to sustainability and reducing inequality' In Research Working Paper No 2. World Bank China Office.
Lewis, A 1955 The Theory of Economic Growth. London: Taylor and Francis.
Ma, G McCauley, R, and Lam, L 2012 'Narrowing China's Current Account Surplus: The role of saving, investment and the renminbi' In H. McKay and L. Song (Eds.), Rebalancing and Sustaining Growth in China (pp. 65-91). Canberra: ANU E Press.
National Development and Reform Commission 2012, March 5 Full Text: Report on China's Economic and Social Development Plan. Viewed 26 November 2012, (see china.org.cn).
National People's Congress 2011 China's Twelfth Year Plan (2011-2015) — the Full English Version, Translation by Delegation of the European Union in China. 11 May, viewed 20 November 2012 (see China's Twelfth Year Plan website).
Sharma, D and Yao, H (forthcoming) Modelling Chinese Consumption. Treasury Working Paper Series.
World Bank 2006 China Quarterly Update, November 2006.
Xinhua 2007 Premier: China confident in maintaining economic growth. 16 March Viewed 19 November 2012 (see Xinhua news).
Xinhua (2012, November 17) Full text of Hu Jintao's report at 18th Party Congress, Accelerating the Improvement of the Socialist Market Economy. Viewed 19 November 2012 (see
Xinhua (2012, 11 8) Hu vows to boost domestic demand. Viewed 22 November, 2012 (see
1 The authors are from the International Economy Division, the Australian Treasury. This article has benefited from comments and suggestions provided by Owen Freestone, Dougal Horton, Jason McDonald, Barry Sterland, Hui Yao and Dong Zhang. The views in this article are those of the authors and not necessarily those of the Australian Treasury.
2 The term 'rebalancing' can be translated into Chinese as 重新平衡 (chongxin pingheng) and is used in Chinese in the context of resolving global macroeconomic imbalances, rather than in the context of 'rebalancing' China's economy toward consumption.
3 'We should firmly maintain the strategic focus of boosting domestic demand, speed up the establishment of a long-term mechanism for increasing consumer demand, unleash the potential of individual consumption, increase investment at a proper pace, and expand the domestic market' (Xinhua, 2012).