After three years of very strong growth, the Australian economy experienced a slowdown in the second half of 2000, before rebounding to solid growth in the first half of 2001. The slowdown mainly reflected the impact of a range of one-off factors which changed the timing and composition of growth. In particular, there was a large decline in residential construction, which wound back the record levels of activity experienced by the industry in anticipation of the introduction of The New Tax System.
The weakness in the labour intensive construction sector in the latter part of 2000 flowed through to related parts of the manufacturing sector and resulted in slower employment growth, lower consumer spending and a decline in business confidence. These effects were in conjunction with adverse seasonal conditions in the farm sector, the contractionary impact of higher oil prices on consumer spending and a sharp slowing in world growth, only partly offset by the stimulus from the Olympics and the boost to exports from a lower exchange rate.
Despite a rapidly weakening world economy, Australia's net exports made a large positive contribution to growth in 2000-01, with the terms of trade also improving. The current account deficit as a proportion of GDP declined to a twenty year low.
Abstracting from some identifiable temporary or one-off influences on consumer prices, including the introduction of The New Tax System and sharply higher world oil prices, inflation remained within the 2 to 3 per cent target band.
Overview of the economy in 2000-01 |
|||
|
Temporary slowdown in the Australian economy. |
After three years of very strong growth in excess of 4 per cent, the Australian economy experienced a sharp slowdown in the second half of 2000, with the weakness concentrated in the residential construction sector and related parts of the manufacturing sector. |
||
|
Nevertheless, the slowdown was temporary, with GDP growth rebounding to a strong 1.2 per cent and 1.1 per cent in the June and September quarters respectively of 2001. |
|||
|
Reflecting the sharper than expected weakness of the first half of the 2000-01 financial year, year average growth was a modest 1.8 per cent. |
|||
|
A number of factors interacted to lower growth. |
The most significant factor contributing to the slower than expected growth in the second half of 2000 was a very sharp but temporary decline in dwelling investment. Changes in the timing of activity associated with The New Tax System (TNTS) saw residential construction activity rise to around its highest level as a share of GDP in around 20 years in the June quarter 2000, followed by a fall of 31 per cent in the second half of the year. |
||
|
|
The decline in residential activity in the second half of 2000 was not confined to the construction of new dwellings. Alterations and additions (AA), which comprises around 44 per cent of dwelling investment, also fell by a record amount in these two quarters. Investment in AA had grown strongly through much of the 1990s. Because the decline in dwelling investment was concentrated in the first half of the financial year, it had a greater impact on year average growth than if the same 31 per cent decline had been evenly distributed over the course of the year. |
||
|
Early evidence of dwelling sector recovery. |
The housing sector stabilised in the first half of 2001, with forward indicators at the end of 2000-01 pointing to very strong growth in the months ahead. Indeed, the housing sector contributed very strongly to economic growth in the September quarter 2001. |
||
|
Household consumption grew by 2.5 per cent in 2000-01, below the 4.1 per cent increase in 1999-2000. This reflected a number of factors including the impact of higher world oil prices on Australian petrol prices. The result was a reduction in funds available to households for more discretionary expenditure. Higher interest rates in the first half of the year, the dampening effect of the weaker housing sector and modest growth in private sector wealth also acted to dampen consumption growth. |
|||
|
New private business investment fell modestly in 2000-01. The main factor impacting on new investment was the large decline in non-residential construction as Olympic-related work wound down and uncertainty in relation to the world economic outlook increased as the year progressed. |
|||
|
After world growth of 4.7 per cent in 2000, the global economic outlook for 2001 weakened considerably and official and private sector organisations downgraded their forecasts for world growth in 2001 progressively from late 2000 onwards.1 While a moderation in world growth in 2001 had been anticipated in the 2000-01 Budget and 2000-01 MYEFO, and many of the negative factors that acted together in the second half of 2000 had been identified, the turning point in the cycle arrived earlier and the slowdown was deeper than forecast. |
|||
|
Net exports contributed to economic growth. |
Despite the sharp weakening in the world economy as the year progressed, net exports contributed a much stronger than expected 1.8 percentage points to overall economic growth in Australia in 2000-01, boosted by a competitive exchange rate and the impact of significantly weaker domestic demand growth on the demand for imports. The positive contribution to growth from net exports was a major turnaround from the negative contribution to growth in 1999-2000. |
||
|
Australia's terms of trade continued to rise steadily during the course of 2000-01 in the face of the weakening world economy. Commodity prices held up reasonably well on world markets, with some important commodities such as coal, iron ore, beef and wool actually increasing in $US terms. Australia also benefited from subdued prices for key imports such as Information, Computer and Telecommunications (ICT) equipment as the world economy weakened. |
|||
|
Australia's strong trade performance, improving terms of trade and relatively low world and domestic interest rates (which helped to keep the Net Income Deficit (NID) in check), contribut |
|||
|
Employment was affected by the building sector downturn. |
Employment increased by 2.1 per cent in 2000-01. However, the downturn in the labour intensive construction sector had flow-on effects in the labour market, reversing a large part of the employment growth that occurred in the first two months of the 2000-01 financial year. The unemployment rate averaged 6.4 per cent for the year, compared with 6.6 per cent in 1999-2000. |
||
|
Wages increased by 3.9 per cent in 2000-01, with no obvious impact on wage outcomes flowing from the one-off increase in prices associated with the introduction of TNTS. |
|||
|
Leaving aside one-off factors, inflation remained within the 2-3 per cent target band. |
The headline Consumer Price Index (CPI) increased by 6.0 per cent in both year-average and through-the-year terms in 2000-01. In through-the-year terms, TNTS is estimated to have contributed around 2½ per cent to the increase, with fuel and fruit and vegetable prices contributing around another ½ of one per cent and ¼ of one per cent respectively. Leaving these one-off influences aside, the CPI increased by around 2¾ per cent in through-the-year terms in 2000-01, in line with the 2 to 3 per cent medium-term inflation target band. |
||
Comparison of forecasts against outcomesInternational economy |
|||
|
World GDP grew by 4.7 per cent2 in 2000, up from 3.6 per cent in 1999 and well above its long-term average growth rate. The outcome for 2000 was slightly above the 2000-01 Budget forecast of 4¼ per cent but in line with the 4¾ per cent growth forecast in the 2000-01 MYEFO.3 |
|||
|
Strength in global economy in the first part of 2000... |
The strength of the global economy in 2000 was largely the result of very strong growth early in the year in the US, strong growth in Europe, positive growth in Japan and a strong rebound in non-Japan East Asian economies. Robust economic growth in the first half of 2000 and a range of positive factors, including an expected easing in oil prices, resulted in an upgrading of the forecast for world economic growth by half a percentage point for both 2000 and 2001 in the 2000-01 MYEFO. |
||
|
|
In the event, economic growth in the US fell more sharply than expected in the second half of 2000 and the first half of 2001, with large spillover effects on other regions. A range of forces began to act concurrently toward the end of 2000 and into 2001, including the restraining influence of earlier monetary policy tightening in the US, high energy prices4 and falling equity prices. As a result, inventories underwent a significant adjustment and investment fell sharply in line with substantial excess capacity and a reassessment of the likely returns, particularly in the high technology sectors. |
||
|
Monetary policy in the US was then eased promptly in early 2001 and fiscal policy was supportive. The lower interest rates provided homeowners with a significant boost to disposable income by reducing mortgage payments. In addition, mortgage refinancing allowed many homeowners to increase their mortgage balance on refinancing, as this provides a ready means to `cash out' unrealised capital gains. Consumer confidence remained high and income growth was robust. Oil prices also declined. Together, these developments seemed to have played a role in sustaining consumption in the latter half of 2000-01. |
|||
|
growth in most countries slowed concurrently... |
The initial and most significant impact of the slowdown in the US was on those countries with close trade links with the US, including countries in East Asia. Trade, investment and financial market linkages transmitted the downturn globally and exacerbated vulnerability in individual countries. As a result, conditions in the global economy deteriorated markedly through the first half of 2001, with growth in most countries slowing concurrently and several recording negative growth. |
||
|
and the outlook for 2001 weakened considerably. |
As a result of developments in the US, the outlook for world growth in 2001 weakened considerably and official and private sector organisations downgraded their forecasts progressively from late 2000 onwards. While a slowdown in world growth in 2001 had been anticipated in the 2000-01 Budget and MYEFO, and many of the negative factors that acted together in the last half of 2000 had been identified, the turning point in the cycle arrived earlier and the slowdown was deeper than forecast. |
||
Domestic economy |
|||
|
In Table 1, the 2000-01 actual outcomes are compared with the Budget and MYEFO forecasts for the Australian economy. |
|||
| Table 1: 2000-01 Budget and MYEFO forecasts and outcomes
|
|||
|
(a) Calculated using original data, except average earnings and the labour market measures which are calculated using seasonally adjusted data. |
|||
Domestic demand |
|||
|
Growth was expected to moderate in 2000-01... |
In compi |
||
|
and the composition of growth was expected to change. |
The moderation in growth in 2000-01 was expected to be accompanied by a significant rebalancing of the components of growth. Domestic demand was expected to grow at a more moderate pace than over the preceding three years, reflecting some lagged effects of the increase in interest rates during 1999-2000 as well as an unwinding of a net bring-forward of expenditure ahead of TNTS. The easing in domestic demand growth was expected to be partially offset by stronger net exports, reflecting what was forecast to be a strengthening international economy in 2000, a boost to service exports from the Olympics, and the competitive level of the exchange rate. |
||
|
The economic growth forecast for 2000-01 was revised up in the 2000-01 MYEFO to reflect a stronger world outlook than seemed likely at Budget time, and a lower exchange rate, which together were expected to provide an added boost to net exports. At the same time, some components of domestic demand were revised down, particularly dwelling investment and business investment. |
|||
|
But the slowdown was sharper than expected. |
While the outlook in the 2000-01 Budget and 2000-01 MYEFO incorporated an expected easing in domestic demand to reflect an unwinding of a net bring-forward of expenditure ahead of TNTS, the slowdown in the second half of 2000 proved to be much sharper than expected. The weakness was concentrated in the residential construction sector, which had flow on effects to other parts of the economy including related parts of the manufacturing sector, resulting in lower employment, consumer spending and business sentiment. Net exports, on the other hand contributed more than expected to growth in 2000-01, despite the weakening world economy. |
||
|
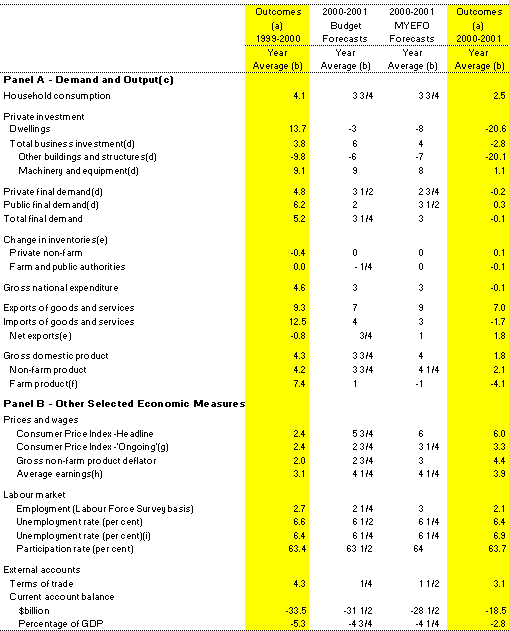
Chart 1: Contributions to GDP growth 2000-01
|
|||
|
(a) These components, along with intangible fixed assets, livestock, and ownership transfer costs make up `private final demand'. |
|||
|
Solid contribution to growth from household consumption. |
Household consumption rose by 2.5 per cent and contributed 1.5 percentage points to GDP growth in 2000-01, moderating from the very strong growth recorded in earlier years. |
||
|
The 2.5 per cent increase in household consumption was somewhat lower than the 3¾ per cent forecast in the 2000-01 Budget and MYEFO. The weaker than expected outcomes were concentrated in the first half of 2000-01, when consumption grew by just 0.6 per cent. In part, this reflected higher than expected petrol prices which reduced expenditure on other discretionary items, higher interest rates in the first half of 2000-01, the indirect effects of the sharp contraction in the dwelling sector and relatively modest growth in private sector wealth. |
|||
|
The introduction of TNTS on 1 July 2000 had an effect on the timing of household expenditure decisions. After 1 July, the unwinding of the bring-forward in retail trade was approximately offset by an increase in the purchase of passenger motor vehicles, due to changes in the relative prices of these items with the introduction of the TNTS. Therefore the net impact on household consumption growth in 2000-01 is estimated to have been relatively small and broadly in line with expectations. |
|||
|
Strong rebound in household consumption in second half of 2000-01. |
Household consumption growth rebounded very strongly in the first half of 2001, growing by 2.6 per cent over the March and June quarters. This was underpinned by lower petrol prices, a reduction in interest rates and a strong pick-up in private sector wealth, mainly reflecting the sharp rise in property values, which increased by around 6 per cent in the first half of 2001. |
||
|
Forecasts for dwelling investment overstated activity. |
In 2000-01, total dwelling investment fell by more than 20 per cent in year average terms, a much larger fall than forecast in the 2000-01 Budget and MYEFO. This larger than expected decline in dwelling investment, and the probable flow on effects to the rest of the economy, was the major area where the Budget and MYEFO forecasts overestimated the actual strength of the domestic economy. Even leaving aside the flow on effects, the direct impact of the housing downturn alone accounted for a total of 1¼ percentage points of the difference between the 2000-01 Budget forecast for economic growth and actual outcomes. |
||
|
Prior to the introduction of TNTS, dwelling investment (Chart 2) rose well ahead of underlying demand as home buyers sought to bring-forward their purchases ahead of 1 July 2000. This led to dwelling investment rising to its highest level as a share of GDP in the June quarter 2000 in around 20 years. |
|||
|
New dwelling activity fell by around 34 per cent in the second half of 2000. |
The decline in construction of new dwellings in 2000-01 as a whole was broadly in line with earlier expectations. However, it was much more heavily concentrated in the September and December quarters than had seemed likely around the time of the 2000-01 Budget and MYEFO. At that time, there were widespread anecdotal reports that a large volume of `pre TNTS' building work would carry over into at least the September quarter, suggesting that building activity would not begin to decline until late in the year. In the event, however, construction of new dwellings fell sharply in both the September and December quarters, with a decline of around 34 per cent. |
|
|
Chart 2: Dwelling investment |
||
|
|
||
|
Source: ABS Cat. No. 5206.0. |
||
|
AA fell by much more than was expected. |
Having experienced a sustained period of strong growth during most of the 1990s, investment in alterations and additions (AA) (which accounts for around 44 per cent of overall dwelling investment), also fell sharply in 2000-01 (Chart 3). The year average fall in 2000-01 was more than 17 per cent, compared to the next largest fall of around 13 per cent in 1982-83. Importantly, as was also the case with the construction of new dwellings, the fall in AA was concentrated in the September and December quarters of 2000, with a decline of around 27 per cent over those two quarters. |
|
|
Chart 3: Annual growth in alterations and additions |
||
|
|
||
|
Source: ABS Cat. No. 5206.0. |
||
|
Even leaving aside the flow on effects to other parts of the economy, the 31 per cent decline in residential construction in the September and December quarters of 2000 was sufficient to reduce economic growth in Australia by 2.0 per cent over these two quarters. To illustrate the impact of the sharper than expected housing downturn, had housing activity remained steady, economic growth in Australia (other factors unchanged) would have been a relatively strong 1.8 per cent in the first half of the financial year. |
||
|
The housing sector stabilised in the first half of 2001, aided by declining interest rates and the Government's more generous First Home Owners Scheme. Forward indicators pointed to very strong growth in later quarters of 2001. Indeed, the housing sector contributed very strongly to economic growth in the September quarter 2001. |
||
|
Business investment fell. |
After eight years of solid growth, including growth of almost 4 per cent in 1999-2000, private new business investment fell by 2.8 per cent in 2000-01. This outcome was well below the 2000-01 Budget forecast of 6 per cent growth, and the 4 per cent growth forecast in the 2000-01 MYEFO. |
|
|
The overall decline in new business investment reflected weaker than expected growth in machinery and equipment investment and a large decline in non-residential construction. |
||
|
Large decline in non-residential construction... |
In year average terms, private non-residential construction declined by 20.1 per cent in 2000-01, compared with the 2000-01 Budget forecast of a 6 per cent decline and the 2000-01 MYEFO forecast of a 7 per cent decline. |
|
|
as Olympics and other work was completed. |
Non-residential construction continued to fall from its peak in 1998-99, as the stock of Olympics related work was exhausted and several large engineering construction projects were completed. |
|
|
Investment in new machinery and equipment rose by 1.1 per cent in 2000-01, moderating from around 9 per cent growth in 1999-2000. The 2000-01 outcome compares with the 9 per cent growth forecast in the 2000-01 Budget and the 8 per cent growth forecast in the 2000-01 MYEFO. |
||
|
Slowdown in second half of 2000 was a factor in reduced overall equipment investment in 2000-01. |
The slowdown in the Australian economy in the second half of 2000 is likely to have been a significant contributing factor to moderating growth in equipment investment over the course of 2000-01. Sharply slower growth in investment in new computer equipment probably also reflected a high level of investment in this area in 1999-2000 in response to Y2K and preparation for the introduction of TNTS. |
|
|
In addition, the weakening world outlook that became increasingly apparent as the year progressed appeared to have an effect on most measures of business confidence, and likely led some businesses to reduce and/or delay their equipment investment. |
||
|
The lower than expected 2000-01 outcome also partly reflected significant revisions to data since the March quarter 2001 National Accounts. |
||
|
Nevertheless, investment in the capital-intensive mining industry picked up in the first half of 2001, as mining profits continued to grow strongly. |
||
|
Public final demand was forecast to grow by a moderate 2 per cent in the 2000-01 Budget, following very strong growth in 1999-2000. The forecast was revised up to 3½ per cent (consistent with trend growth) at the 2000-01 MYEFO, due to additional expenditure expected on administrative costs associated with defence, immigration and telecommunications. |
||
|
Growth in public demand was modest. |
The 2000-01 Budget and MYEFO forecasts overstated the actual outcome for public final demand of 0.3 per cent growth in 2000-01, in part reflecting a higher expectation for defence expenditure than actually occurred. |
|
|
The difficulties in determining a seasonal pattern for public final demand since the introduction of accrual accounting was a significant factor in the volatility of the series over 2000-01. |
||
External sector |
||
|
Net exports contributed to growth in 2000-01. |
Despite a general slowdown in the world economy that started around the December quarter 2000, net exports contributed 1.8 percentage points to economic growth in 2000-01. This was substantially above the 2000-01 Budget and MYEFO 2000-01 forecast of a ¾ of a per cent and 1 percentage point contribution respectively, reflecting the impact of the lower exchange rate relative to the Budget assumption, and the impact on imports of lower than expected growth in domestic demand. The strong contribution to growth in 2000-01 represented a major turnaround from the negative contribution of 0.8 percentage points in 1999-2000. |
|
|
Export growth was strong... |
Export volumes of goods and services grew by 7.0 per cent in 2000-01, in line with the May 2000 forecast. Both goods and services exports posted solid gains in the year, growing by more than 6 per cent and 10 per cent respectively. |
|
|
The staging of the Sydney Olympics boosted service exports, and exports of elaborately transformed manufactures (ETMs) increased by around 11 per cent, building on the strong rebound from the Asian crisis of almost 18 per cent in 1999-2000. |
||
|
Growth in rural and non-rural commodity export volumes was more moderate in 2000-01, although slightly above expectations at Budget, growing by 3.7 per cent and 5.1 per cent respectively. Growth in rural exports reflected favorable world market conditions for meat and wool products, partly offset by below average seasonal conditions for crop production. Growth in export volumes of non-rural commodities was driven by higher world prices for crude oil and strong demand for coal and iron ore. |
||
|
while imports fell. |
Following very strong growth in 1999-2000, import volumes fell 1.7 per cent in 2000-01, the first annual decline since 1990-91, reflecting the impact of lower than expected growth in domestic demand and the lower exchange rate. The outcome was well below the 2000-01 Budget forecast for import volumes growth of 4 per cent, and 2000-01 MYEFO forecast of 3 per cent growth. |
|
|
The decline was led by capital goods which fell almost 10 per cent, following a 24 per cent rise in 1999-2000, and reflected the weaker than expected outcomes for business investment. Intermediate and other goods also declined by 2.5 per cent. In contrast, consumption goods imports increased almost 9 per cent. |
||
|
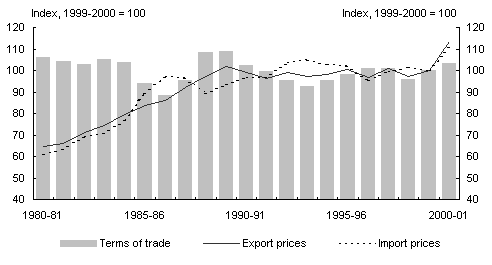
The terms of trade rose... |
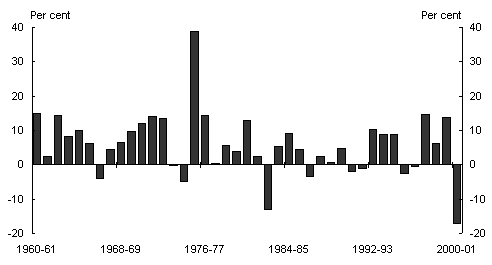
The terms of trade continued to rise steadily in 2000-01, up around 3 per cent, well above the 2000-01 Budget and MYEFO forecasts of ¼ of a per cent and 1½ of a per cent increase respectively, despite the deteriorating world outlook. The terms of trade had fallen moderately in 1998-99, reflecting the effects of the Asian crisis but recovered in 1999-2000 (Chart 4). |
|
|
as export prices rose faster... |
Export prices rose over 13 per cent in 2000-01. Tight supply conditions in some of Australia's export markets combined with a lower exchange rate boosted prices for rural exports over the year. Non-rural export prices also posted large gains. US dollar commodity prices - as measured by the RBA commodity price index - rose about 3 per cent in 2000-01, reflecting increases in coal, iron ore, beef and wool prices. The Australian dollar index increased almost 21 per cent as the lower Australian dollar further boosted commodity prices in Australian dollar terms. |
|
|
than import prices. |
Import prices increased about 10 per cent over the year. However, the rise in import prices largely reflected the effect of a lower exchange rate, with the world price of imports remaining subdued. In particular, Australia benefited from very competitive prices of ICT equipment (being a key import) in 2000-01, as the world economy weakened. On the other hand, the price of fuels and lubricants rose particularly strongly over the year, up 41 per cent. |
|
|
Chart 4: Australia's terms of trade |
||
|
|
||
|
Source: ABS Cat. No. 5302.0. |
||
|
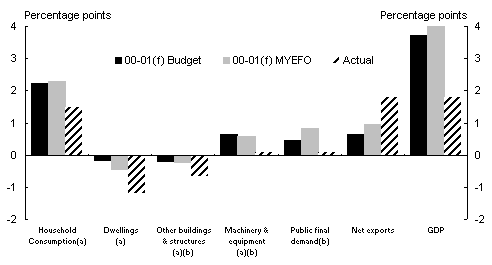
|
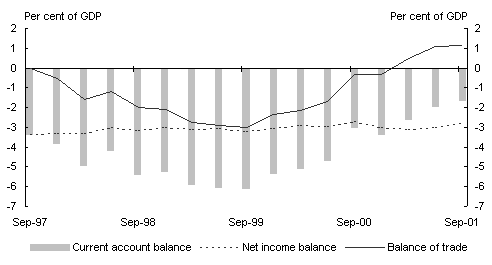
Supported by the continued rise in the terms of trade, the strong net export contribution and relatively low world and domestic interest rates (which helped to keep the Net Income Deficit (NID) in check), the current account deficit (CAD) fell to 2.8 per cent of GDP in 2000-01, from 5.3 per cent of GDP in the previous year. In dollar terms, the deficit fell $15.0 billion to $18.5 billion (Chart 5). As a share of GDP, the CAD was the lowest since 1979-80. |
|
|
Chart 5: Australia's current account balance as a share of GDP |
||
|
Source: ABS Cat. No. 5302.0. |
||
Labour market |
||
|
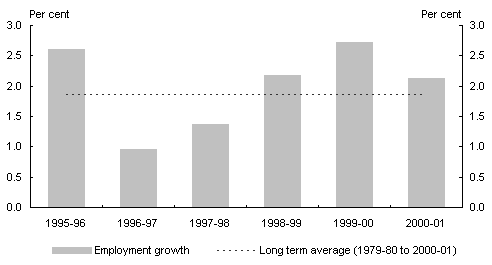
In year-average terms, employment was 2.1 per cent higher (around 190 000 persons) in 2000-01, compared with employment growth of 2.7 per cent in 1999-2000. This moderation in employment growth - towards its long-term average - was consistent with the 2000-01 Budget outlook of 2¼ per cent, although well below the upwardly revised 2000-01 MYEFO estimate of 3 per cent. |
||
|
Chart 6: Year-average employment growth |
||
|
Source: ABS Cat. No. 6202.0. |
||
|
Very high employment growth in July and August. |
In July and August 2000, employment increased by over 95 000 and employment growth surged to 3.7 per cent through the year to July and August. This increase was very large by historical standards, and although discounted to some extent, was an important factor behind the increase in the official forecasts for employment growth between the Budget and MYEFO. |
|
|
Employment falls sharply near end-2000. |
The brief very strong surge in employment probably reflected in part a stronger than anticipated build up to the Sydney Olympics and strong activity in business services related to the introduction of TNTS. On the other hand, it is now apparent that the surge in employment occurred at a time when the residential construction sector, which is very labour intensive and a major employer, was experiencing a record decline in activity. In that sense, developments in the labour market in the early part of the financial year seemed to mask developments in the residential construction |
|
|
As outlined in the 2000-01 MYEFO, some unwinding of this strong employment growth in July and August was expected at the time that the MYEFO forecasts were being finalised in late September. In the event, the downturn in employment in September, October and November was very sharp and largely reversed the exceptional employment growth that had occurred in the first two months of the financial year. The extent of the downturn in key labour intensive sectors such as construction, together with ongoing adjustments in the manufacturing sector proved to be larger and more protracted than expected. |
||
|
In year-average terms, the unemployment rate was 6.4 per cent - only a little above the 2000-01 MYEFO forecasts (6¼ per cent). Strong employment growth in the early months of the financial year helped the unemployment rate to fall to a decade low of 6 per cent in September and October 2000. However, the subsequent downturn in employment resulted in the unemployment rate rising moderately over the remainder of the year, averaging 6.9 per cent in the June quarter 2001, above the 2000-01 Budget and 2000-01 MYEFO forecasts of 6¼ per cent. |
||
Wages and prices |
||
|
|
Growth in wages picked up slightly in 2000-01, but the overall rate of growth remained moderate. Average non-farm earnings on a National Accounts (AENA) basis increased by 3.9 per cent in 2000-01, slightly below the 2000-01 Budget and MYEFO forecasts of 4¼ per cent. The increase included around a ½ of a percentage point contribution from the increase in the superannuation guarantee charge on 1 July 2000. Other wage measures also showed a moderate increase in wage growth, such as the wage cost index which increased by 3.4 per cent in 2000-01, up from 2.9 per cent in 1999-2000. More generally, wage outcomes remained in line with medium-term trends. There was no obvious impact on wage outcomes flowing from TNTS despite earlier concerns in some quarters that the one-off increase in prices associated with the introduction of the TNTS would flow through into higher wages. |
|
|
The CPI increased by around 6 per cent in 2000-01... |
The headline CPI increased by 6.0 per cent in year-average and through-the-year terms in 2000-01. This outcome was only slightly higher in year-average terms than the 2000-01 Budget forecast of 5¾ per cent and was consistent with the 2000-01 MYEFO forecast. |
|
|
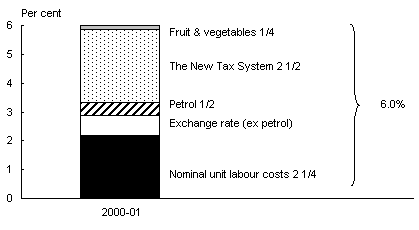
Chart 7 provides an indicative breakdown of the major contributors to the increase in the headline CPI through the year to the June quarter 2001. It should be noted that the components of the chart are rounded to the nearest quarter percentage point, and the chart does not show all of the individual influences on the CPI over the year. |
||
|
Chart 7: Estimated contributions to the 2000-01 |
||
|
(a) Subtotals may not add due to rounding. Source: Treasury estimates. |
||
|
The increase in the headline CPI in 2000-01 included the impact of a range of temporary and one-off factors. The most significant of these related to the introduction of TNTS on 1 July 2000. |
||
|
largely due to the one-off effects of TNTS... |
TNTS is estimated to have contributed a little less than 3 percentage points to the overall CPI increase of 3.7 per cent in the September quarter 2000, significantly lower than the 3¾ percentage points forecast in the 2000-01 Budget. |
|
|
Through the year to the June quarter 2001, TNTS is estimated to have contributed around 2½ percentage points to the headline CPI increase of 6.0 per cent. |
||
|
as well as some pass-through of the depreciation in the $A... |
The significant decline in the exchange rate (with the $A declining around 15 per cent and 7 per cent against the $US and TWI respectively, over the course of 2000-01) is estimated to have contributed around ¾ of one percentage point to the increase in the CPI over the course of the year. |
|
|
and several other temporary and seasonal factors. |
Various other temporary influences also affected the CPI over 2000-01. Domestic petrol prices rose by around 11 per cent, driven by a 17 per cent increase in world oil prices and the lower exchange rate. Fruit and vegetable prices were also affected by adverse seasonal conditions, including flooding in northern NSW and southern Queensland in late 2000. In through-the-year terms, fuel and fruit and vegetable prices contributed around ½ of one percentage point and ¼ of one percentage point respectively, to the overall rise in the CPI. |
|
|
Abstracting from these factors, inflation remained well within the target band. |
Looking through these one-off and temporary factors, inflation over 2000-01 remained comfortably within the 2-3 per cent medium-term inflation target band. |
|
Fiscal policy |
||
|
Further reduction of net debt. |
During 2000-01, the Government continued to meet its objective of achieving budget balance, on average, over the course of the economic cycle. The Commonwealth general government sector achieved an underlying cash surplus of $5.6 billion (0.8 per cent of GDP) in 2000-01. This was the fourth consecutive underlying cash surplus. The fiscal surplus was $5.9 billion (0.9 per cent of GDP) in 2000-01. The 2000-01 underlying cash surplus, together with the proceeds from sales of financial assets, allowed for Commonwealth general government net debt to be further reduced from 8.4 per cent  |
|
|
The fiscal and underlying cash balances for 2000-01 were respectively $0.5 billion and $2.8 billion larger than was anticipated at the 2000-01 Budget. This mainly reflected strong taxation collections in 2000-01, partially offset by higher than anticipated spending due, in part, to economic parameter variations and new policy decisions. Monetary policy Over the course of 2000-01, Australian monetary policy moved from a tightening cycle to an easing cycle. In August 2000, the Reserve Bank of Australia (RBA) increased official interest rates by 25 basis points to 6.25 per cent to ensure that inflationary pressures remained contained while the economy was allowed to continue growing at a sustainable rate. In 2001, the RBA moved monetary policy to a more expansionary stance in order to support growth in domestic demand as the international economy deteriorated more quickly than expected and dwelling investment fell temporarily. The RBA lowered official interest rates on three separate occasions in the first half of 2001, by a total of 125 basis points, to 5 per cent. Most major economies also lowered official interest rates in the first half of 2001 due to the deterioration in international economic conditions. The United States was the most aggressive, lowering rates by 275 basis points in the first half of 2001, while the European Central Bank cut interest rates by 25 basis points in May. |
Bond and equity markets |
||
|
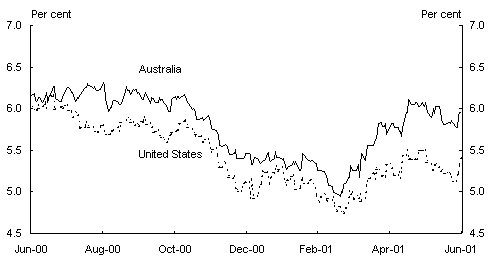
Bond yields fell over most of the year, reaching a low in mid-March. |
Australian 10-year bond yields broadly tracked those of the US over 2000-01. The yield on Australian 10-year bonds fell slightly from around 6.2 per cent at the beginning of 2000-01 to around 6.0 per cent at the end (Chart 8). In mid-March 2001, the 10-year bond yield fell to below 5 per cent, reflecting concern over the global economic outlook. Following this, bond yields rose sharply until late May 2001, reflecting improved perceptions of the economic outlook for Australia and the US, and an improvement in equity prices in both countries. |
|
|
The differential between Australian and US bond yields increased over the last quarter. |
The differential between Australian and US bond yields increased a little during this period, from an average of around 30 basis points over the first three quarters to an average of around 60 basis points in the last quarter. This increasing differential is likely to have reflected a stronger short to medium-term outlook for economic growth in Australia than in the US. |
|
|
Chart 8: 10-Year bond yields - Australia and the US, 2000-01 |
||
|
Source: Reuters |
||
|
|
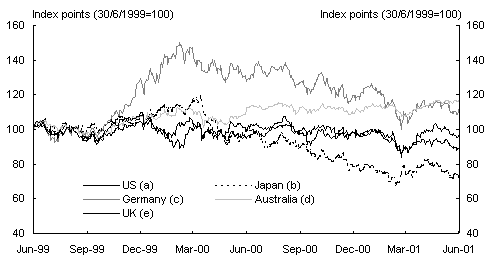
US and Australian equity markets finished 2000-01 little changed from their starting points (Chart 9). However, other major world equity markets drifted lower through the year. Australia's benchmark ASX200 index increased by 5.4 per cent over 2000-01, somewhat lower than the average gains seen in recent years. |
|
|
World equity markets in 2000-01 were affected by the continued unwinding of the earlier boom in information technology shares, the weakening in the US economy that became apparent in the latter part of 2000 and the uncertainty regarding the timing of its recovery. The low point for most markets was in March 2001, followed by some recovery until mid-May 2001, reflecting some improved perceptions of the economic outlook. Japanese equity markets were particularly affected by pessimism surrounding the outlook for the Japanese economy. |
||
|
Chart 9: Movements in major stock indices 2000-01 |
||
|
|
||
|
(a) Dow Jones Industrials |
||
Exchange rates |
|||
|
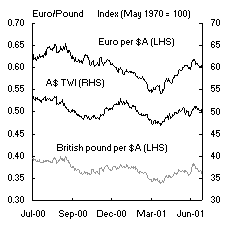
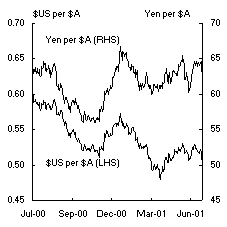
The $A declined by around 15 per cent against the $US and 7 per cent on a TWI basis over the course of 2000-01 (Chart 10). |
|||
|
The decline in the $A helped support net exports. |
The decline in the $A helped support the very strong contribution made by net exports to economic growth in 2000-01, despite the sharp deterioration in the world outlook as the year progressed. The low Australian dollar and subdued inflation converted a nominal depreciation into a real depreciation, and helped the position of exporting and import-competing firms. |
||
|
Chart 10: The Australian dollar: 2000-01 |
|||
|
|
|
||
|
Source: Reuters |
|||
Concluding comments
While Australia's economic growth in 2000-01 of 1.8 per cent was well below recent outcomes, the weakness was highly concentrated in terms of its timing and sectoral composition. In particular, the weakness was concentrated in the first half of the financial year and was driven largely by developments in the residential construction sector.
By the second half of the financial year, the residential construction sector had stabilised, with forward indicators pointing to a period of very strong growth in this sector in 2001-02. The residential construction sector contributed very strongly to growth in the September quarter 2001. The overall economy grew solidly during the second half of the financial year, at annualised rates more in line with longer-term trends.
In contrast, the impact of the international downturn, which became more pronounced as the year progressed, appears to have been muted. Negative reporting of overseas developme
nts is likely to have been a factor impacting on business confidence during the first half of 2001 and may have contributed to a weaker than expected outcome for business investment in 2000-01. Nevertheless, even in the face of the deteriorating world economy, export volumes held up reasonably well buoyed by the Olympics and the lower exchange rate, and net exports made a major contribution to economic growth.
Australia's terms of trade continued to increase steadily through the year and the current account deficit reached 20-year lows, both for the year as a whole and in the September quarter 2001.
As noted in the 2001-02 Budget and 2001-02 MYEFO, the major and largely synchronised slowdown in world economic growth is likely to have a more significant impact on Australia's export performance and terms of trade in 2001-02. This is expected to coincide, however, with much stronger growth in domestic demand in 2001-02, including a sharp upswing in the residential construction sector, with the net outcome expected to be solid economic growth in 2001-02.
1 The IMF world GDP growth forecast for 2001 was 4.2 per cent in October 2000, and was progressively lowered to 2.4 per cent by December 2001. Similarly, the OECD downgraded its forecast of OECD average GDP growth for 2001 from 3.3 per cent in December 2000 down to 1.0 per cent in November 2001.
2 Real GDP, weighted on a purchasing power parity (PPP) basis.
3 The IMF's forecast for world GDP growth (real terms, PPP basis) for 2000 published in the World Economic Outlook was 4.2 per cent in May 2000 and was 4.7 per cent in October 2000. The OECD's forecast for 2000 OECD GDP growth published in the Economic Outlook was 4.0 per cent in June 2000 and 4.3 per cent in December 2000.
4 World oil prices surged in 2000, from a world trade-weighted average of US$17.49 per barrel in 1999 to US$27.57 in 2000. This outcome compares to the 2000-01 MYEFO forecast of $US27½ per barrel for 2000 and the 2000-01 Budget forecast of $US25 per barrel. The world trade-weighted average oil price is a weekly contract price weighted by export volume, and is compiled weekly by the US Department of Energy's Energy Information Administration.