|
The Australian economy grew strongly in 2001-02, in excess of the forecasts in the 2001-02 Budget and 2001-02 Mid-Year Economic and Fiscal Outlook (MYEFO). Growth was driven by residential construction and household consumption expenditure, which more than offset a decline in net exports associated with the weaker global economic environment. The Government's enhanced First Home Owners Grant, in addition to historically low mortgage interest rates, contributed to a strong rebound in residential construction. This, together with low interest rates and rising household wealth, flowing primarily from large rises in established house prices, underpinned solid household consumption growth. Consumer confidence and business sentiment proved to be remarkably resilient, rebounding quickly from their temporary falls associated with the events of September 11. Employment growth moderated from the previous year and was concentrated in the retail trade and construction sectors, reflecting the main drivers of growth in the economy over 2001-02. With Australia's growth continuing to outpace that of its major trading partners, net exports subtracted from growth in 2001-02. However, the terms of trade continued to improve despite the weak global economic conditions. The current account deficit increased from its 20-year low as a proportion of GDP in 2000-01 but remained below its average over the 1990s. Inflation remained within the 2 to 3 per cent medium-term target band in 2001-02, with labour costs remaining subdued, reflecting moderate wages growth combined with rapid increases in productivity. |
||
Overview of the economy in 2001-02 |
||
|
Strong growth in 2001-02 |
The Australian economy grew strongly in 2001-02, by 3.8 per cent in year average terms, in excess of the forecasts in the 2001-02 Budget (Budget) and the 2001-02 Mid-Year Economic and Fiscal Outlook (MYEFO). Growth was driven by residential construction and household consumption expenditure, which more than offset a decline in net exports associated with the weaker global economic environment. |
|
|
In contrast with weaker global conditions |
The Australian economy strengthened as 2001 progressed, despite the weak global economic conditions, and remained solid in the first half of 2002, recording 3.8 per cent growth through the year to the June quarter 2002. Australia's economy was one of the strongest in the developed world in 2001-02. |
|
|
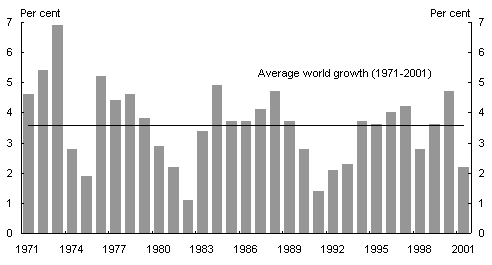
The world economy grew by 2.2 per cent in 2001, the slowest rate of growth in almost a decade, after recording strong growth of 4.7 per cent in 2000. |
||
|
The economic forecasts were revised down slightly at MYEFO, in the wake of the September 11 terrorist attacks in the US, as it was expected that these events could be detrimental to consumer confidence and could possibly delay some business investment decisions. In the event, consumer and business confidence recovered quickly from their sharp decline in the immediate aftermath of September 11 and contributed to the Australian economy maintaining momentum throughout 2001-02. |
||
|
Dwelling investment rebounded strongly from the temporary slowdown in 2000-01, increasing 18.7 per cent in 2001-02, to contribute 0.9 percentage points to GDP growth in the year. |
||
|
The strength of residential construction boosted spending on durable goods. Consumer spending was also assisted by low interest rates, declining petrol prices and strong growth in household wealth. |
||
|
Private new business investment grew by 5.2 per cent in 2001-02, contrasting with a 2.9 per cent decline the year before. Subdued business investment in previous years, coupled with strong corporate profitability, low interest rates, a competitive exchange rate and strengthened business sentiment created supportive conditions for the pick up in private new investment in 2001-02. |
||
|
Employment increased by 1.1 per cent in 2001-02, following three years of annual growth above 2 per cent and was concentrated primarily in the areas of retail trade and construction. The unemployment rate averaged 6.6 per cent in 2001-02, although by the June quarter it was down to 6.3 per cent. |
||
|
Average non-farm earnings rose by 3.8 per cent in 2001-02, unchanged from the previous year. Inflation remained within the 2 to 3 per cent medium-term target band in 2001-02, with a 2.9 per cent increase in the CPI in year average terms. |
||
|
The current account deficit increased moderately to 3.1 per cent of GDP in 2001-02, but remained well below its average share of GDP during the 1990s. |
||
Comparison of forecasts against outcomes |
||
International economy |
||
|
World growth slowed in 2001 |
Australia's economy continued to perform strongly in 2001-02, despite many of Australia's trading partners experiencing much slower growth. The world economy grew by 2.2 per cent in 2001, the slowest rate of growth in almost a decade, after recording strong growth of 4.7 per cent in 2000 (see Chart 1). The outcome for 2001 was well below the Budget forecast of 3¼ per cent, but was in line with the revised 2¼ per cent growth forecast in the MYEFO, the latter forecast being prepared in the immediate aftermath of September 11 and in the light of mounting evidence of a significant slow down in the United States. |
|
|
Chart 1: World GDP Growth(a) |
||
|
|
||
|
(a) World GDP growth rates are calculated using GDP weights based on purchasing power parity. |
||
|
In 2001, the US, Japan and Germany were in recession |
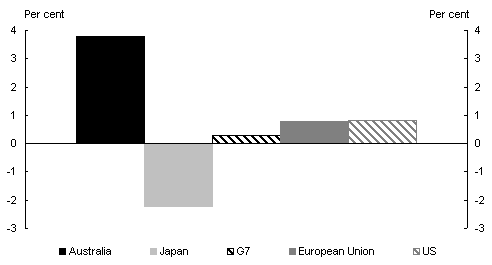
The major industrial countries of the G7 were in recession during 2001 and experienced their weakest period of growth since the early 1980s. The United States (US) entered recession in early 2001, and Australia's largest trading partner, Japan, experienced recession for the third time in ten years. Growth in the European Union stalled in 2001 with Germany, the major economy in the region, also entering recession. The weakness in developed economies was transmitted to developing countries principally through slower demand for their exports. Consequently, the economies of Australia's major trading partners in East Asia also weakened in 2001, with output falling in several countries, particularly those highly dependent on exporting high-tech equipment. In contrast with these international developments, Australia's economy performed strongly in 2001-02 (see Chart 2). |
|
|
Chart 2: Australia's GDP growth outperforms the world in 2001-02(a,b) |
||
|
|
||
|
(a) Percentage change on previous year. (b) Growth rates for the G7 and the European Union are calculated using weights based on purchasing power parity. The G7 comprises the United States, Japan, Germany, France, Italy, the United Kingdom and Canada. Source: National Statistical publications, International Monetary Fund. |
||
|
Excess capacity in ICT |
The slow down in growth developed in the world economy over 2001 can be attributed, in part, to the speculative excesses of the late 1990s. Of particular note was the extremely high investment in information and communication technology (ICT) capacity - which was most pronounced in the US. Expectations of returns on ICT investment in the US were (until recently) very optimistic, providing a powerful magnet for capital, which was sourced mainly from foreign savings. After a prolonged period of exceptionally strong growth, capital spending by US businesses fell sharply during 2001.1 ICT spending accounted for around two-thirds of the overall reduction in capital spending, as faltering demand exposed the excess capacity in this area. |
||
|
September 11 weakened confidence |
The unprecedented shock and the aftermath of September 11 were expected to exacerbate the weakness in the US and the world economy, raising the spectre of a sharper and deeper downturn. In the US, inventory accumulation was wound back and investment spending reduced further in line with weaker demand and overcapacity, particularly in the manufacturing and high-tech sectors. The decline in confidence soon spread as global business and consumer sentiment fell against a heightened state of uncertainty and risk aversion. This was reflected in sharp falls on global equity markets immediately following September 11, although markets recovered later in 2001. |
||
|
US policymakers responded to the downturn |
Monetary policy was eased aggressively in 2001 to counter the weakness in US demand that emerged with the contraction in investment spending and the instability that followed the terrorist attacks of September 11. By the end of 2001, the Federal Reserve had lowered the federal funds rate by 475 basis points to 1¾ per cent, the lowest level in forty years. This action, together with tax cuts in June 2001 (worth around 0.4 per cent of GDP) helped support an already resilient household sector through the US recession in 2001 (which was relatively mild) and averted a more serious downturn. |
||
|
World-wide easing of policies |
Immediately following the events of September 11, central bankers worldwide responded by cutting interest rates aggressively. The US Federal Reserve reduced rates by 150 basis points in the month following September 11, the European Central Bank and the Bank of England both cut rates by 100 basis points over a similar period - many other developed and developing economies did the same. Several countries also announced additional fiscal stimulus packages. The US had already provided tax cuts in June 2001 but followed this up with additional corporate and personal tax cuts worth around 1 per cent of GDP. Japan announced an additional fiscal stimulus package worth around 0.2 per cent of GDP. In continental Europe targeted packages were introduced, with the most notable being the French government's assistance provided to affected airports and airlines. A number of East Asian countries also announced additional stimulus measures, including tax relief in Hong Kong and Singapore and public works programs in China, South Korea and Malaysia. |
||
|
Signs of global recovery emerged in early 2002 |
Signs of a global recovery began to emerge in early 2002 as inventory adjustments neared completion and business and consumer confidence strengthened. Combined with very supportive monetary and fiscal policies in many economies, prospects appeared to be favourable for an early recovery. World trade began to rebound in the early part of 2002 as inventory rebuilding commenced and US imports rebounded strongly.2 As a result, global industrial production began to strengthen over this period despite ongoing weakness in the Euro area. |
||
|
Corporate accounting concerns emerge |
That said, as 2002 progressed, US corporate governance and financial accounting standards came under intense scrutiny, leading to increased uncertainty in financial markets. Corporate accounting malpractices were exposed, with notable examples being first Enron, and then subsequently Worldcom and Quest Communications, companies that had reported artificially inflated profits through questionable accounting practices. A series of Securities and Exchange Commission and US Justice Department investigations brought to light the extent of the corporate malaise, raising investor concerns. |
||
|
Stock markets fell globally |
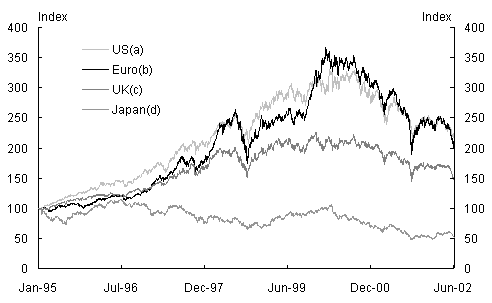
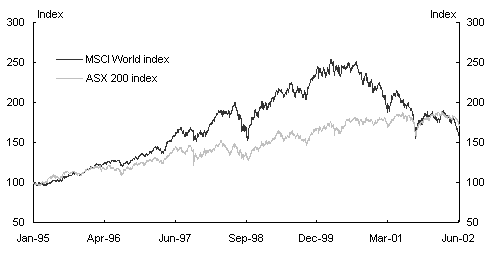
These factors led to a sharp fall in equity prices in all major financial markets in 2001-02 that has continued to date (see Chart 3). |
||
|
While signs of a global economic recovery had emerged early in 2002, it became apparent by mid 2002 that the recovery was vulnerable to risks surrounding the outlook for the US economy. These included a low saving rate, high levels of debt in both the corporate and household sectors, and a large current-account deficit in excess of 4 per cent of GDP. This renewed onset of uncertainty about the US economy was reflected in continued weakness in US and global equity ma |
|||
|
Chart 3: Movements in major indices |
|||
|
|
|||
|
(a) S&P 500 index (b) Euro STOXX Broad Euro-zone index (c) FTSE 100 index (d) Nikkei 225 index Source: Reuters |
|||
Domestic economy |
|||
|
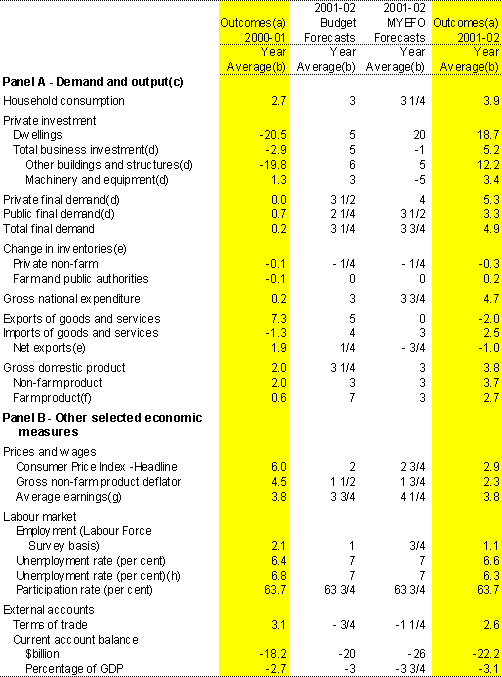
Table 1 compares the actual outcomes for the domestic economy in 2001-02 with both the Budget and MYEFO forecasts. |
|||
|
Table 1: 2001-02 Budget and MYEFO forecasts and outcomes |
|||
|
|
|||
|
(a) Calculated using original data, except average earnings and the quarterly labour market measures which are calculated using seasonally adjusted data. (b) Percentage change on preceding year unless otherwise indicated. (c) Chain volume measure. (d) Excluding transfers of net second-hand asset sales from the public sector to the private sector. (e) Percentage point contribution to growth in GDP. (f) Calculated at basic prices. (g) Average non-farm compensation of employees (national accounts basis). (h) The level in the June quarter of each year. |
|||
Domestic demand |
|||
|
Growth was expected to pick-up in 2001-02... |
The Budget forecasts were prepared on the basis that economic growth would return to around the longer-term trend rate in 2001-02, following the temporary dwelling investment-led weakness observed in the latter part of calendar 2000. |
||
|
...underpinned by a rebound in the dwellings sector and solid business investment |
With an absence of imbalances in the Australian economy, domestic demand was expected to grow strongly in 2001-02. In particular, a rebound in dwelling investment and a solid contribution from business investment were forecast to be the key factors underpinning the pick-up in GDP growth. |
||
|
The increase in demand was expected to outweigh an anticipated decline in net exports due to the expected weakness in global economic conditions. |
|||
|
The September 11 attacks prompted a slight downgrade to the growth forecast at MYEFO... |
The economic growth forecast was subsequently revised down slightly at MYEFO in the wake of the September 11 terrorist attacks. The downgrade predominantly reflected a significant reduction to the forecast contribution from net exports. The business investment forecast was also revised down, in anticipation of some deferral of investment projects. Consumers were also assumed to moderate their spending in response to the heightened uncertainty. On the other hand, in view of the momentum already evident in the dwelling sector and forward indicators such as commencements, the forecast for dwelling investment was revised up significantly at MYEFO. |
||
|
...but the economy proved to be more resilient than expected. |
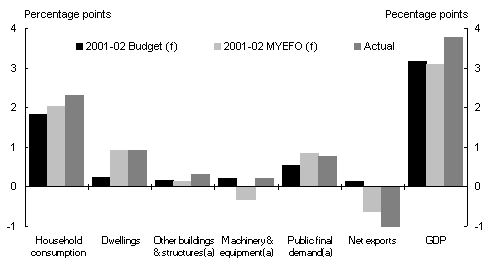
In the event, the Australian economy proved to be more resilient than anticipated and overall economic growth in 2001-02 was higher than forecast at both Budget and MYEFO. The contribution of household consumption in particular was stronger than had been forecast. This outcome, combined with a contribution from dwelling investment which was in line with that forecast at MYEFO, more than offset a larger than anticipated subtraction from net exports. |
||
|
Chart 4: Contributions to GDP growth 2001-02 |
|||
|
|
|||
|
(a) Excluding transfers of net second hand asset sales from the public sector to the private sector. |
|||
|
Household consumption provided solid contribution to growth. |
Household consumption rose strongly by 3.9 per cent and contributed 2.3 percentage points to GDP growth in 2001-02. |
||
|
The 3.9 per cent increase in household consumption was above the 3 per cent forecast in the Budget and the 3¼ per cent forecast in the MYEFO. The stronger outcome than forecast reflected a robust end to 2001-02 with three consecutive quarters of growth well above trend. This period of strength, which followed moderate growth in the September quarter 2001, surpassed expectations with consumers showing remarkable resilience to the events of and surrounding September 11. |
|||
|
Consumer confidence recovered after the events of September 11. |
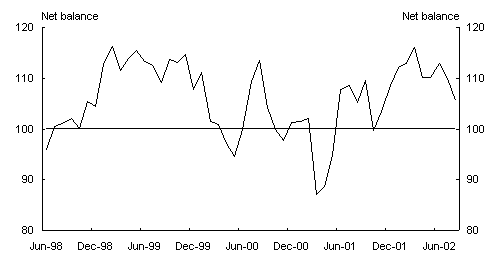
Consumer confidence, as measured by the Westpac-Melbourne Institute index, fell sharply in the first reading following September 11 before rebounding to be well above the relatively high pre-September 11 levels (Chart 5). In contrast, the MYEFO forecasts were prepared on the assumption that consumer confidence would decline sharply and remain at below average levels well into 2002. |
||
|
Chart 5: Westpac-Melbourne Institute Consumer Sentiment Index
|
|||
|
Strong household consumption built on solid base. |
Robust consumption growth was particularly evident in spending on durable goods, which, in part, reflected high levels of activity in the residential housing market. More generally, declining interest rates, lower petrol prices and strong growth in household wealth provided conditions conducive to the solid pace of consumption growth. |
||
|
Household spending power was boosted by falling household interest expenses, as official interest rates fell by 2 percentage points over the course of 2001. The strong gains in household wealth flowed primarily from large rises in established house prices. |
|||
|
Solid contribution to GDP growth from dwelling investment. |
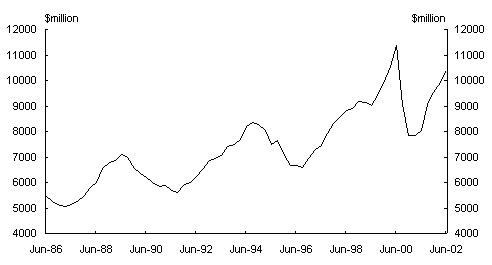
Dwelling investment rebounded strongly from the temporary slowdown in 2000-01, increasing 18.7 per cent in 2001-02, to contribute 0.9 percentage points to GDP growth in the year. By June 2002, activity in this sector was near the record level reached in the lead up to the implementation of The New Tax System, and well above previous cyclical peaks. |
||
|
Chart 6: Dwelling investment (chain volume measure) |
|||
|
|
|||
|
Source: ABS Cat. No. 5206.0. |
|||
|
Significant upward revision to the forecast at MYEFO. |
The rebound in dwelling investment in 2001-02 was significantly stronger than forecast in the Budget, but in line with the MYEFO forecast. By MYEFO, a combination of the apparent strong take-up of the additional First Home Owners Scheme (FHOS) and the reduction in housing interest rates to historical lows prompted a substantial upward revision to the forecast. |
||
|
Construction of new dwellings was particularly strong... |
The recovery in dwelling investment saw the construction of new dwellings increase by 21.4 per cent in 2001-02. The proportion of housing finance going to first home buyers increased to 25 per cent in the second half of 2001, above its longer run average of around 21 per cent. Mortgage interest rates fell to a historical low of 6 per cent by the end of 2001. |
||
|
and was supported by growth in alterations and additions. |
Alterations and additions also grew strongly in 2001-02, continuing the upturn of the first half of 2001. In year-average terms, alterations and additions rose 15.2 per cent, the largest financial year increase in over 25 years. Strong gains in household wealth, largely reflecting solid increases in house prices in recent years, coupled with low interest rates also underpinned activity in the home improvement market. |
||
|
Dwelling investment boosted economic growth. |
The rebound in dwelling investment in 2001-02 contributed to sustaining strong growth in the domestic economy during a year in which many of Australia's major trading partners' were in recession. In 2001-02, the sector contributed 0.9 percentage points to GDP growth of 3.8 per cent. The recovery in dwelling investment had important flow on effects to other parts of the economy, particularly household consumption and the labour market. |
||
|
Business investment rose despite global downturn. |
Private new business investment recovered in 2001-02, growing by 5.2 per cent. This outcome was in line with the Budget forecast of 5 per cent, but above the 1 per cent decline forecast in the MYEFO. The business investment forecast was revised down at MYEFO in anticipation that the heightened international uncertainty following the September 11 terrorist attacks in the US would result in a delay or cancellation of some investment projects. In the event, most measures of business confidence only declined for a brief period after September 2001. Business investment continued to grow, reflecting the sound fundamentals of the domestic economy. In year average terms, private non-residential construction grew by 12.2 per cent in 2001-02, above both the Budget forecast of 6 per cent growth and the MYEFO forecast of 5 per cent growth. |
||
|
Rebound in non-residential building construction following post Olympic slow down. |
Non-residential construction recovered strongly from the decline that resulted from the end of Olympic-related work as several large engineering construction projects came on-line. |
||
|
Investment in new machinery and equipment rose by 3.4 per cent in 2001-02, following modest growth of 1.3 per cent in 2000-01. The 2001-02 outcome was in line with the Budget forecast of 3 per cent growth and above the MYEFO forecast of a decline of 5 per cent. |
|||
|
Exceptional growth in investment in the mining industry was the main factor in the growth in machinery and equipment investment. |
The growth in new machinery and equipment was driven by a very strong increase in the mining industry. This reflected high levels of profitability in the mining sector which was buoyed by the competitive level of the Australian dollar together with higher prices for some commodity exports on world markets, such as gold. This was against a background of subdued mining investment over the previous two years. |
||
|
In 2001-02, underlying public final demand3 increased at a solid pace, with growth of 3.3 per cent (in line with the MYEFO forecast), well above the 0.7 per cent increase recorded in 2000-01. At the Commonwealth Government level, this reflected spending associated with the war on terror, airport security and border protection. State and Local government investment also grew strongly, underpinned by a number of infrastructure projects. |
|||
|
Underlying public final demand contributed 0.8 percentage points to economic growth in 2001-02, in line with the MYEFO forecast. |
|||
External sector |
|||
|
Export growth declined ... |
Reflecting the weakness in the world economy, export volumes fell by 2.0 per cent in 2001-02, much weaker than the Budget forecast of 5 per cent growth and the MYEFO forecast of no growth. Merchandise exports grew by a modest 0.1 per cent, while service exports declined by a record 9.4 per cent. |
||
|
...following the Olympics Games... |
The record decline in service exports (mainly inbound tourism) largely reflected an unwinding of the impact of the Olympic Games on inbound tourism (which grew by 11.7 per cent in 2000-01). Tourism was further affected by the terrorist attacks of 11 September 2001, the collapse of Ansett, and the subsequent global downturn in travel. |
||
|
... and the decline in farm exports.... |
Rural commodity exports also declined substantially, falling by 5.7 per cent in 2001-02, the largest decline in 7 years. While production of cereals increased by 4.2 per cent in 2001-02, part of the increase went into stocks rather than being exported. Wool exports declined with lower sheep numbers. Higher prices for lamb and mutton relative to wool encouraged increased slaughtering. Beef exports fell, partly reflecting lower demand associated with food safety concerns in Japan. Growth in exports of non-rural commodities slowed in 2001-02, at 0.7 per cent, as production approached capacity constraints. Growth in the exports of elaborately transformed manufactures remained markedly below trend, rising by just 1.0 per cent in 2001-02, reflecting the weak global economic conditions despite a very competitive level of the Australian exchange rate. |
||
|
while imports were recovering. |
Following the decline in 2000-01, import volumes rose by a moderate 2.5 per cent in 2001-02 in year average terms, somewhat lower than the Budget forecast of 4 per cent, but up by 11.9 per cent over the year to June 2002. |
||
|
The turnaround in imports was largely driven by the increase in capital good imports, which rose by 10 per cent in 2001-02. Growth in consumption and intermediate good imports remained below trend, rising by 3.2 per cent and 2.3 per cent. |
|||
|
The terms of trade rose, despite the global downturn... |
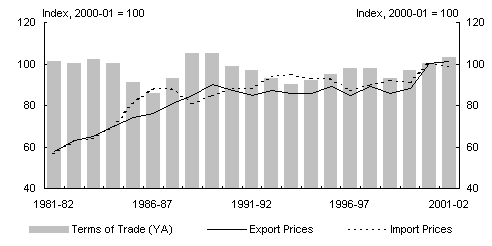
The terms of trade continued to increase in 2001-02, up by 2.6 per cent, compared with Budget and MYEFO forecast declines of ¾ per cent and 1¼ per cent respectively (Chart 7). |
||
|
...as export prices rose... |
Export prices rose by 1.2 per cent in 2001-02. The increase in part reflected the favourable conditions for world prices of rural and non-rural commodities, which rose by 1.7 per cent and 4.3 per cent in US dollar terms. This was sufficient to offset the large decline in base metal prices, which fell by 13.3 per cent. |
||
|
...and import prices fell. |
Import prices fell by 1.4 per cent in 2001-02. The decline in import prices was particularly evident in the prices of fuels and computer equipment. The price of fuels and lubricants fell by 20.0 per cent, partly unwinding the 42.3 per cent increase in the previous year. The price of ICT products continued the decline evident in recent years, falling by 13.2 per cent in 2001-02. |
||
|
Chart 7: Australia's terms of trade |
|||
|
|
|||
|
Source: ABS Cat. No. 5302.0. |
|||
|
The increase in the terms of trade in 2001-02 stands in contrast with Australia's longer term historical experience, where the terms of trade have usually fallen sharply during global downturns, with significant, adverse effects on domestic incomes. In contrast, since 2000 Australia's terms of trade has increased despite the slowing of the world economy. In addition, the rising terms of trade reflected steady export prices and a decline in import prices, therefore putting downward pressure on inflation (longer terms of trade trends in Australia are discussed in more detail in the 2002-03 Budget Statement 4, reproduced in the Autumn 2002 Economic Roundup). |
|||
|
The CAD increased from its 20-year low. |
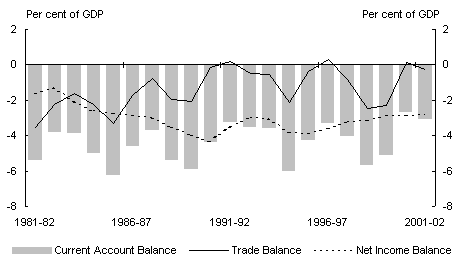
The current account deficit (CAD) increased moderately from its 20-year low of 2.7 per cent of GDP in 2000-01, to 3.1 per cent of GDP in 2001-02 (Chart 8). This compares with the Budget and MYEFO forecasts of 3 per cent and 3¾ per cent of GDP respectively. The increase in the CAD mainly reflected the large net export subtraction to GDP growth, partly offset by the increase in the terms of trade. The servicing of Australia's net foreign liabilities - the net income deficit - remained unchanged from 2000-01 at 2.8 per cent of GDP. |
||
|
Despite the moderate increase in 2001-02, the CAD remained well below the 10-year average of around 4¼ per cent of GDP, and markedly below historical peaks of around 6 per cent of GDP. The debt servicing ratio - the proportion of exports required to pay the interest on net foreign debt - continued to trend downwards, to be 9.2 per cent in the June quarter 2002, well below the peak of 20.0 per cent recorded in the September quarter 1990. |
|||
|
Chart 8: Current account balance as a share of GDP |
|||
|
Source: ABS Cat. No. 5302.0. |
|||
Labour market |
|||
|
Continued expansion in part-time employment |
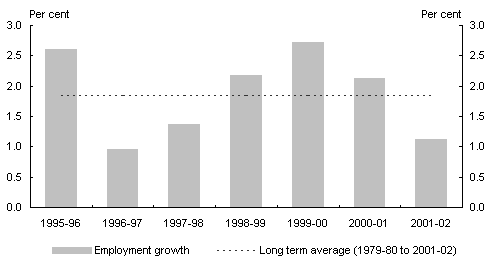
In year-average terms, employment increased by 1.1 per cent in 2001-02, following growth of 2.1 per cent in the previous year (Chart 9). The increase in employment was driven by a 5.8 per cent increase in part-time employment (an increase of 142 000 persons), partly offset by a 0.6 per cent decline in full-time employment (a decline of 40 000 persons). |
||
|
Chart 9: Year-average employment growth
Source: ABS Cat. No. 6202.0. |
|||
|
Employment growth consistent with forecasts |
The moderation in overall employment growth in 2001-02 was in line with the Budget forecast for employment growth of 1 per cent, although above the ¾ of a percentage point growth forecast in the MYEFO. |
||
|
The downward revision to the employment growth forecast at MYEFO reflected a slight downward revision to the GDP growth forecast, due to the uncertain global economic environment and its expected impact on business confidence and hiring intentions. |
|||
|
Employment growth was concentrated in the retail and construction sectors |
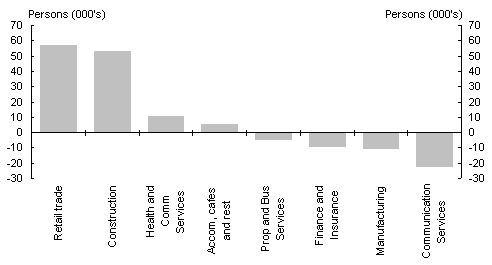
Solid growth in the retail sector over 2001-02 lead to a pick-up in the number of retail jobs, which is likely to have added significantly to the overall expansion in part-time employment in 2001-02. In addition, the strong rebound in residential building activity flowed on to robust employment growth in the construction sector. The surge in activity across residential construction and retail trade in 2001-02 resulted in overall employment growth being concentrated in these two labour intensive sectors through the year to June 2002 (Chart 10). |
||
|
Chart 10: Employment growth in selected industries
Source: ABS Cat. No. 6203.0. |
|||
|
Sectoral differences in employment growth |
In contrast, there were significant declines in employment in the communications and information technology areas. Employment in the manufacturing sector also declined in 2001-02. |
||
|
The unemployment rate resumed its overall downward trend in 2002 |
In year-average terms, the unemployment rate was 6.6 per cent in 2001-02 - below the 7 per cent forecast in both the Budget and MYEFO. A surge in employment growth in the early months of 2002 helped the unemployment rate to fall to an average of 6.3 per cent in the June quarter of 2002. |
||
Wages and prices |
|||
|
Wages growth remained moderate in 2001-02. |
Wages growth remained moderate in 2001-02, with most measures indicating a fall in the rate of wages growth from 2000-01. Average non-farm earnings on a National Accounts (AENA) basis increased by 3.8 per cent in 2001-02, unchanged from 2000-01. This outcome was in line with the Budget forecast of 3¾ per cent, but below the MYEFO forecast of 4¼ per cent. The wage cost index (WCI) increased by 3.3 per cent in 2001-02, down from 3.5 per cent in 2000-01. |
||
|
In contrast, average weekly ordinary time earnings (AWOTE) grew by 5.5 per cent in 2001-02, up from 5.3 per cent in 2000-01. However, this measure is significantly affected by compositional factors, including changes in the industry composition of full time employment. |
|||
|
The headline CPI increased by less than 3 per cent in 2001-02. |
The headline CPI increased by 2.9 per cent in year average terms and 2.8 per cent in through the year terms in 2001-02, within the 2-3 medium term target band. This outcome was higher than the Budget forecast of 2 per cent, but consistent with the MYEFO forecast of 2¾ per cent. |
||
|
The medium-term drivers of inflation had a moderate impact... |
The medium-term drivers of inflation remained moderate in 2001-02. Growth in unit labour costs was subdued, reflecting steady wages growth as outlined above and significant gains in labour productivity, and there was little evidence of supply constraints developing in the economy. Further, compared with 2000-01, the exchange rate was largely unchanged in year average terms. |
||
|
Airfares, meat and fruit prices and insurance costs rose.. |
A significant proportion of the CPI increase in 2001-02 relative to the expectation at Budget can be attributed to price rises in a few key expenditure classes. Airfares were affected by the collapse of Ansett and the events of September 11, increasing the price of domestic and overseas holiday travel. Fruit prices rose due to adverse supply conditions and meat prices increased due to strong export demand. The price of hospital and medical services increased, due in part to increased private health insurance premiums. |
||
|
partly offset by lower petrol prices. |
Partly offsetting these increases, domestic petrol prices fell by around 5 per cent, driven by a 20 per cent decline in world oil prices. |
||
Fiscal policy |
|||
|
. |
The Government's medium-term fiscal strategy is to maintain budget balance, on average, over the course of the economic cycle. Budgetary outcomes in 2001-02 were consistent with this broad objective. |
||
|
The Commonwealth general government sector recorded an underlying cash deficit in 2001-02 of around $1.3 billion (0.2 per cent of GDP). The fiscal deficit in 2001-02 was around $4 billion (0.5 per cent of GDP). |
|||
|
Further reduction in net debt |
Commonwealth general government net debt was again reduced, from 5.8 per cent of GDP at 30 June 2001 to 5 per cent of GDP at 30 June 2002, as the proceeds of asset sales were used to retire debt. |
||
|
Fiscal policy was used to maintain solid economic growth |
In both 2000-01 and 2001-02 expansionary fiscal policy supported the domestic economy in the face of a weaker international environment. The medium-term fiscal strategy allows fiscal policy to respond to short-term economic fluctuations, and policy settings in the past two years helped Australia maintain solid economic growth relative to other developed countries. |
||
Monetary policy |
|||
|
Over the course of 2001-02, Australian monetary policy moved from an easing cycle to a tightening cycle. |
|||
|
In the second half of 2001, the Reserve Bank of Australia (RBA) continued to move monetary policy to a more expansionary stance in order to support growth in domestic demand, as the international economic environment weakened. The RBA lowered official interest rates on three occasions in the second half of 2001, by a total of 75 basis points, to 4.25 per cent. Two of these moves came after the events of September 11 as central banks world-wide lowered rates aggressively in the face of financial market instability and risks to the economic outlook. |
|||
|
In the first half of 2002, the RBA removed the additional stimulus introduced after September 11, as global economic recovery appeared to take hold and with the Australian economy continuing to make solid gains. The RBA increased official interest rates on two occasions, in May and June, by a total of 50 basis points. The cash rate was 4.75 per cent in June 2002. |
|||
|
As noted above, there was further easing of monetary policy in major economies in the second half of 2001, due to the continuing deterioration of the international economic environment. This trend accelerated after the terrorist attacks in the US. Some countries, including Canada and New Zealand, increased rates in 2002 (following reductions in late 2001), to reduce economic stimulus in response to improving domestic economic conditions. |
|||
Bond and equity markets |
|||
|
Bond yields fell significantly following the September 11 terrorist attacks in the United States. |
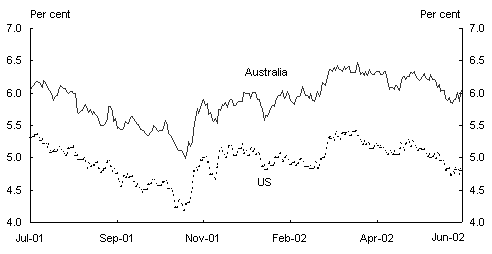
Australian and US 10 year bond yields moved broadly in line with each other over the course of 2001-02. Australian yields fell from above 6 per cent at the start of the period to a low of just under 5 per cent in early November, reflecting concerns about the global economic slowdown and the aftermath of the September 11 terrorist attacks in the US. Yields then rose sharply, to 5.9 per cent in late November, as it became increasingly likely that Australia had emerged largely unscathed from the global economic slowdown. During the first half of 2002 yields fluctuated between 5.5 per cent and 6.5 per cent, ending the period at around 6 per cent. This fluctuation largely reflected uncertainty over the global economic recovery, concerns over the possibility of further terrorist attacks and volatility on global equity markets. |
||
|
The spread between Australian and US bond yields rose during the first half of 2002. |
The spread between Australian and US 10 year bond yields remained steady over the second half of 2001, averaging around 80 basis points. In the first half of 2002, the yield spread increased to around 110 basis points in February, and then remained reasonably steady, fluctuating within a small band. The widening in the spread in 2002 partly reflected the strength and prospects of the Australian economy relative to the US. |
||
|
Chart 11: 10 year bond yields - Australia and the US, 2001-02 |
|||
|
Source: Reuters. |
|||
|
Australian equity prices, as measured by the ASX200 index, fell by around 6.5 per cent during the course of 2001-02, compared with much larger falls of around 18 per cent in the US Wilshire 5000 index, and around a 32 per cent decline in Japan's Nikkei index. This continued the trend evident over recent years where Australian share prices have been more stable than in many overseas markets. |
|||
|
Chart 12: Movements in major stock indices 2000-01 |
|||
|
Source: Reuters. |
|||
Exchange rates |
|||
|
The $A appreciated in 2001-02. |
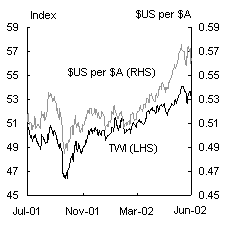
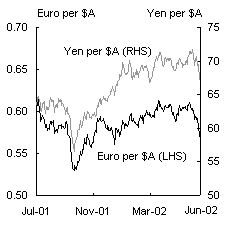
The $A appreciated by about 10 per cent against the $US and about 5 per cent in trade weighted terms over the course of 2001-02 (Chart 13). The currency also rose against the yen, but depreciated against the euro. |
||
|
Chart 13: The Australian Dollar - 2001-02 |
|||
|
Source: Reuters. |
Source: Reuters. |
||
|
Following the September 11 attacks on the US, the exchange rate fell against the major currencies. In the first half of 2002, the currency appreciated strongly as a result of improving prospects for a rebound in international growth. The broad weakness in the US currency supported the $A. |
|||
|
The $A continued to support net exports. |
Despite the increase in the exchange rate over 2001-02, the currency was well below its 1990s average and remained supportive of net exports. |
||
Concluding comments |
|||
|
The economy was remarkably resilient in 2001-02, |
The Australian economy proved to be remarkably resilient in 2001-02 in the midst of an international slowdown. Strong domestic demand throughout the year more than offset declining net exports associated with the global economic weakness. |
||
|
supporte |
The Government's medium-term fiscal and monetary policy frameworks supported the economy. Interest rates have been able to be maintained at historically low levels, supportive of both consumption and investment. |
||
|
a supportive exchange rate, |
The floating exchange rate also helped cushion Australia from the recent global volatility. The supportive level of the dollar acted to increase the competitiveness of both export and import-competing industries. |
||
|
rising and more stable terms of trade. |
Rising and more stable terms of trade, reflecting in part import price falls, raised real incomes, contributed to macroeconomic stability and reduced inflationary pressures. |
||
|
An absence of imbalances |
The Australian economy also benefited from an absence of significant imbalances, like those present in the US linked to the investment boom in ICT capacity. |
||
|
Reaping the benefits from a long-standing comprehensive program of microeconomic reform. |
Finally, the enhanced flexibility and robustness of the economy resulting from the comprehensive program of microeconomic reform undertaken in Australia since the mid-80s also appears to be an important factor behind the economic resilience experienced in the past year. |
||
1 Business capital spending in the US declined in the first three quarters of 2001 by $88.2 billion in annualised inflation-adjusted, or real terms. That represented 154 per cent of the $57.4 billion decline in real GDP over the same period.
2 This surge in US imports reflected the recovery in domestic demand over the first half of 2002.
3 Underlying public final demand is calculated by abstracting from the sale of assets by the public sector to the private sector (the sales are added back into the estimates of government investment).
