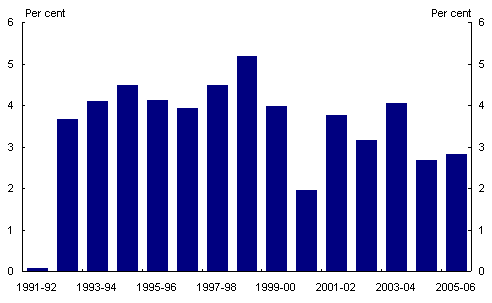
The Australian economy grew by 2.8 per cent in 2005-06, reflecting strong growth in business investment and moderate growth in consumption.1 High export prices have continued to be a major influence on the economy, particularly through stimulating mining and construction investment. The unemployment rate fell to 30-year lows, reflecting robust employment growth, while the participation rate rose to record highs. The Consumer Price Index rose by 3.2 per cent in 2005-06, partly due to the temporary impacts of higher fuel and fruit prices.
Overview
Real GDP grew moderately in 2005-06, but more slowly than in the first few years of this decade. Sharp increases in the prices of key export commodities such as iron ore and coal were important influences on the economy.
Strong demand for non-rural commodities, particularly from China, has boosted non-rural commodity prices and as a result Australia’s terms-of-trade is currently around 30-year highs. This has contributed to very strong investment growth, particularly for the mining sector, but has not yet translated into stronger export volumes, although some non-rural commodity exports have grown strongly.
While GDP growth remains moderate, labour market outcomes have been strong, with robust employment growth contributing to further reductions in the unemployment rate. Household consumption continued to grow moderately following strong growth in recent years, while dwelling investment fell and continued the mild downturn begun in 2004-05.
Inflation rose in 2005-06, partly driven by specific shocks from higher fuel prices and the effects of Cyclone Larry on fruit production and prices. Wage growth was strong, particularly in those sectors experiencing rapid expansion, but improved relative wage flexibility has limited a more generalised wage acceleration.
Chart 1: Real GDP growth
Source: ABS 5204.0.
The world economy
The world economy grew by a strong 4.9 per cent in 2005, after expanding by 5.3percent in 2004 (a 30-year high). This outcome exceeded both the 2005-06 Budget and MYEFO forecasts of 4 and 4 per cent respectively, and occurred despite higher oil prices and the gradual withdrawal of monetary policy stimulus. Growth was underpinned by benign financial market conditions and strong corporate balance sheets.
The world economy continued to expand strongly over the first half of 2006, with a number of countries, in particular China, growing at a faster-than-expected-pace. The pattern of growth across countries became more broadly based, with the pick-up in the Euro area maintaining momentum, Japan’s expansion continuing, and the emerging regions of East Asia and Latin America maintaining impressive growth rates.
Headline inflation rose beyond central bank comfort zones in a number of countries, due largely to the first-round effects of higher oil prices. While the pass-through of higher energy prices to core inflation was generally limited, emergent capacity constraints in both labour and product markets led to a pick-up in core inflation rates in the major economies. In response, monetary policy settings were tightened in a range of countries.
Non-rural commodity prices continued to rise strongly over 2005-06, reflecting robust demand growth associated with the global economic expansion. Energy prices, and particularly oil prices, increased strongly in this period. More recently, prices for base metals have risen strongly.
Chart 2: World GDP growth(a)
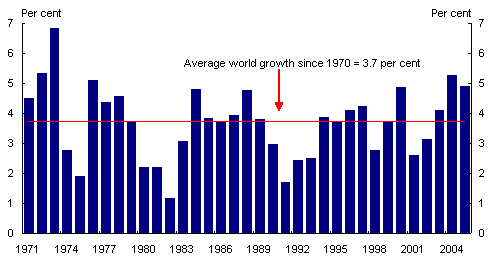
- World GDP growth rates are calculated using GDP weights based on purchasing power parity.
Source: International Monetary Fund.
Developments in key economies
In the United States (US), GDP grew by 3.4 per cent in 2005-06. Private consumption and business investment were the major drivers of growth, while a widening in the US trade deficit saw net exports subtract from growth. The US current account deficit increased over the year, reaching a record US$840 billion or 6.5 per cent of GDP. Employment growth was robust over 2005-06, while strong corporate profits resulted in higher corporate tax receipts. This revenue buoyancy assisted in decreasing the US fiscal deficit, which fell to 1.9 per cent of GDP in the 2006 fiscal year, from 2.6 per cent in 2005.2
Further monetary tightening by the Federal Reserve occurred in 2005-06, with interest rates rising by 200 basis points to 5.25 per cent, following increases of 225 basis points in the previous year. The year also saw signs of a softening in the US housing market. Growth in house prices fell from the previous year’s near-record pace and the contribution of residential investment to GDP growth over the year turned negative in the June quarter 2006.
China’s GDP grew by a faster-than-expected 10.3 per cent in 2005-06, the fastest rate of growth since 1995-96. This strong performance was largely driven by an acceleration in investment growth, with investment in transport infrastructure and real estate particularly strong. Surging net exports also made a strong contribution to growth. The Chinese Government revalued the Renminbi by 2 per cent against the US dollar in July2005, and announced that it would no longer be pegged to the dollar but would be managed with reference to a basket of currencies. By the end of 2005-06 the Renminbi had appreciated by a further 1.4 per cent.
The Japanese economy continued its recovery over the course of 2005-06, with growth becoming increasingly broad-based. Japan’s GDP grew by 3.2 per cent in 2005-06, after growth of 1.6 per cent in 2004-05. The labour market continued to make modest gains, with the unemployment rate reaching an 8-year low of 4.0 per cent in May 2006. Following signs that the economy had emerged from an extended period of deflation, the Bank of Japan ended its policy of quantitative easing in March 2006 and adopted a new monetary policy framework focused on the overnight interest rate.
The rest of East Asia grew by 5.4 per cent in 2005-06, after growing by 4.8 per cent in 2004-05. Growth in the region remained export-led but was also supported by solid growth in domestic demand. Buoyant domestic demand, coupled with growing oil import bills, resulted in a diminishing of current account surpluses in most countries. Investment as a share of GDP generally remained well below levels experienced prior to the Asian financial crisis. Rising inflation emerged as a major concern across the region, mainly due to increases in non-rural commodity prices and the reduction of fuel subsidies. As a result, monetary policy generally maintained a tightening bias throughout the year.
Euro-area GDP growth strengthened to 2.1 per cent in 2005-06 following growth of 1.4percent in 2004-05. This outcome was the strongest since 2000-01, with domestic demand the major contributor. The European Central Bank raised official interest rates due to a pick-up in economic activity and inflation persisting above its medium-term target range. Growth in the United Kingdom in 2005-06 matched Euro-area growth, at 2.1percent, following growth of 2.4 per cent in 2004-05. Weaker private consumption was largely responsible for the easing in growth, partially offset by stronger exports.
Higher oil and non-rural commodity prices were again a significant factor behind the performance of many developing and emerging market
economies. Robust economic growth continued in Latin America over 2005 and picked up over the first half of 2006, with many countries benefiting from the strong global demand for commodities. Higher non-rural commodity prices also benefited the economies of sub-Saharan Africa, with the region experiencing one of its strongest periods of sustained economic expansion since the early 1970s. In emerging Europe, regional economic growth remained robust, despite moderating from the exceptional pace recorded in 2004.
China’s demand for commodities and the terms-of-trade
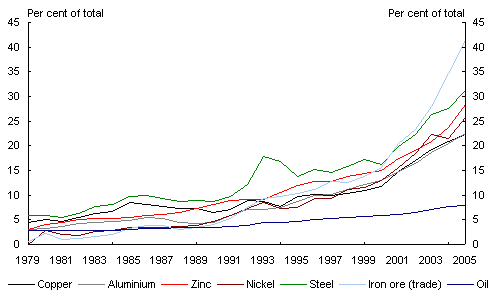
China has had a dramatic impact on a number of globally traded commodities in recent years. As shown by Chart 3, China now accounts for over 40 per cent of the world’s seaborne trade in iron ore, around 30 per cent of the world’s consumption of zinc and steel, and around a quarter of the world’s consumption of copper, aluminium and nickel. In the last few years, the prices of many of these commodities have risen substantially.
The increase in China’s demand for these commodities is being driven by strong economic growth, and in particular, rapid investment growth. Investment in turn is being driven by a number of factors, including: extremely high rates of national saving; a strong comparative advantage in manufacturing; and the continuing process of urbanisation across China, which is leading to a large increase in the demand for housing and infrastructure. China’s urban population has grown by an average of 20million people each year over the past decade.
These factors have led to a rapid increase in China’s demand for construction materials. This demand has outpaced the growth in China’s production of construction materials, leading to a substantial increase in China’s imports of many of these materials in recent years.3
China’s demand for non-rural commodities, combined with the long lag time between investment and new capacity coming on stream, has contributed to the sharp price rises in these resources over 2005-06. Through the year to June 2006 the price of base metals increased by 66 per cent, with zinc and copper prices rising by 160 and 112percent respectively. Coal and iron ore prices also rose significantly in 2005-06 after also increasing sharply in 2004-05.
Chart 3: China’s share of world materials demand (1979-2005)
The Australian economy
The sharp rise in non-rural commodity prices in 2005-06 has contributed to a sharp increase in Australia’s terms-of-trade, driven by a 14.7 per cent increase in export prices and a 3.5 per cent rise in import prices.
The significant increase in the terms-of-trade has boosted national income and generated benefits for the economy. The improved terms-of-trade has also contributed to a healthy environment for business investment, along with strong corporate balance sheets and a low cost of capital.
Chart 4: Australia’s terms-of-trade
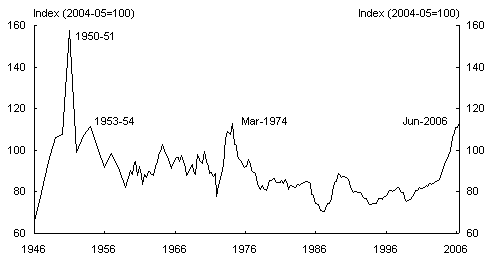
Dates indicate the timing of the peaks in the terms-of-trade.
Source: From September 1959: ABS National Accounts (cat. no. 5206.0), prior to September 1959: MWButlin (1977) ‘A Preliminary Annual Database’, RBA Discussion Paper 7701.
Net exports
Net exports subtracted around 1.1 percentage points from GDP growth in 2005-06. Import volumes grew strongly, reflecting strong business investment, while export volumes grew by less than expected.
Non-rural commodity exports grew by 2.5 per cent in 2005-06, following similar growth in 2004-05. These exports were affected by adverse weather conditions, particularly the impact of Cyclone Clare, in the first half of 2006. Growth in non-rural commodity exports was weaker than expected, reflecting longer lead times associated with mining investment than anticipated at 2005-06 Budget. Farm production increased by 4.5 per cent in 2005-06.
Exports of elaborately transformed manufactures grew by 5.4 per cent in 2005-06, but continued to face competitive pressures from low-cost economies such as China and a relatively high exchange rate.
Service exports remained weak over 2005-06, suffering from continued competitive pressures from Asia and Europe and a sustained higher cost of air travel to Australia.
Imports increased by 6.9 per cent in 2005-06, slightly weaker than the 2005-06 Budget forecast. This result was led by strong growth in capital goods imports, reflecting sustained growth in mining investment.
The current account deficit narrowed from 6.2 per cent of GDP in 2004-05 to 5.4percent of GDP in 2005-06, reflecting a substantial narrowing in Australia’s trade balance, attributable to the improved terms-of-trade position. The improvement in the trade balance was partially offset by a widening in the net income deficit.
Business investment
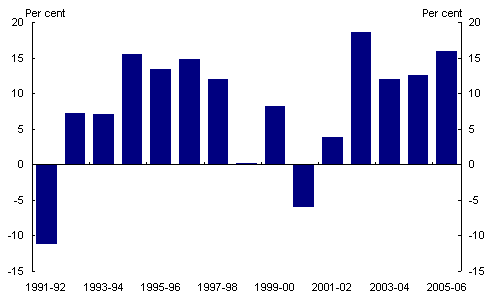
Business investment grew strongly in 2005-06, increasing by 16 per cent after robust growth in the previous four years. Business investment was the largest contributor to GDP growth in 2005-06. Investment growth was broadly based but particularly strong in the mining industry and in related parts of the manufacturing, construction and transport industries. Strong corporate profitability, a low cost of capital and high capacity utilisation have been important factors in the recent strength of investment.
Chart 5: Private business investment growth
Source: ABS 5204.0.
In response to high prices for non-rural commodities, mining investment has grown strongly in recent years. Mining companies invested more than $37 billion over the last three years, with much of this investment directed towards projects in Western Australia and Queensland.
Labour market and wages
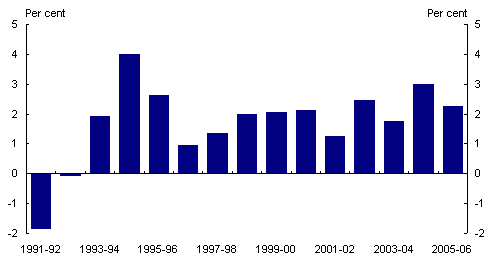
Employment continued to grow strongly in 2005-06, with the unemployment rate reaching its lowest level since 1976 (see Box). Total employment grew by 2.2 per cent in 2005-06, following growth of 3.0 per cent in 2004-05. The number of people in full-time employment rose by 107,000 between June 2005 and June 2006, while part-time employment rose by 71,100.
Total employment increased in all States and Territories through 2005-06. Western Australia had the strongest growth, with employment increasing by 4.6 per cent. Queensland also grew strongly, with total employment increasing by 2.9 per cent. The employment growth in these States is mainly a result of the high export prices, and the resulting increase in investment and incomes in those States.4
Chart 6: Employment growth
Source: ABS 6202.0.
|
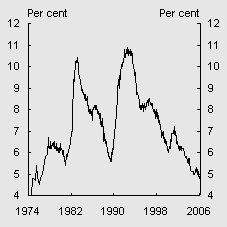
Box: Lowest unemployment rate in 30 years The strong performance of employment growth in 2005-06 helped to push the unemployment rate to 4.9 per cent in May 2006, the lowest rate since the December quarter 1976. Chart B1: Unemployment rate
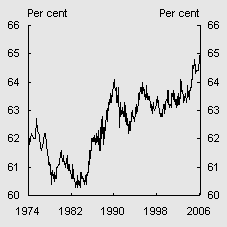
Source: ABS 6202. While the unemployment rate was the same as that of 30years ago, a greater proportion of the population has a job. The employment-to-population ratio has risen from 59.3 per cent in 1975-76 to 61.2 per cent in 2005-06. This increase reflects the substantial rise in the participation rate over the past 30years. |
Chart B2: Participation rate
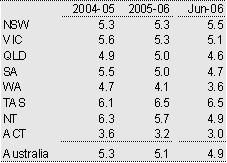
Source: ABS 6202.0. While all States and Territories experienced solid employment growth in 2005-06, changes in the unemployment rate were more diverse, with Western Australia experiencing the largest fall. Table B2: State unemployment rates
Source: ABS 6202.0. Trend figures are used for NT and ACT for the Jun-06 level. |
The influence of the high export prices can also be seen in the industry composition of employment. Employment in the mining industry grew by 21.9 per cent in 2005-06. However, as the mining sector is a relatively small employer, this contributed only slightly to total employment growth, and the larger contribution has come through the associated growth in the construction and business services industries. Strong employment growth was experienced in Construction (growing by 4.7 per cent in 2005-06) and Property & Business Services (5.8 per cent). Employment growth was also strong in Education (6.5 per cent) and Health (5.0 per cent).
Wages grew strongly in 2005-06, partly as a result of the tighter labour market in 2004-05 and 2005-06. The Wage Price Index grew by 4.1 per cent in 2005-06, up from 3.8percent growth in 2004-05. The acceleration in wages was particularly pronounced in the Mining sector (growing by 5.0 per cent in 2005-06) and Electricity, Gas & Water (5.5percent). However, strong wage growth in these sectors has not resulted in broader wage rises.
Prices
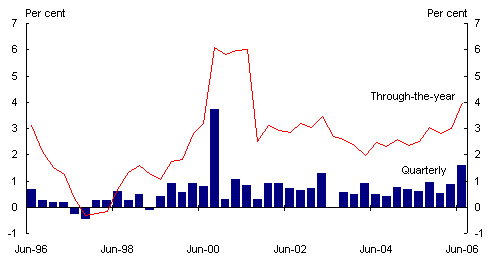
The Consumer Price Index (CPI) showed relatively strong growth of 3.2 per cent in 2005-06, in part reflecting temporary factors such as rises in fuel and fruit prices.
Through the year to the June quarter 2006 the CPI grew by 4.0 per cent, which (excluding the one-off step when the GST was introduced) is the highest rate since 1995. However, other measures of prices show lower rates of growth. The Reserve Bank of Australia’s weighted median and trimmed mean measures of inflation grew by 3.0 and 2.8 per cent respectively.
Chart 7: Consumer Price Index: quarterly and through-the-year growth
Source: ABS 6401.0.
Fruit prices rose by a record 52 per cent in the June quarter 2006, primarily due to a 250percent increase in banana prices, and contributed around 0.5 of a percentage point to the quarterly increase in the CPI. Banana prices increased sharply due to the impact of Cyclone Larry. Fuel prices rose in 2005-06 as world oil prices rose, with automotive fuel prices rising by 24.6 per cent through the year to the June quarter 2006. Excluding the direct impact of these two factors, the CPI grew by 2.6 per cent through the year to the June quarter 2006.
Household consumption and dwelling investment
Household consumption expenditure moderated in 2005-06, while dwelling investment fell and continued the mild downturn begun in 2004-05.
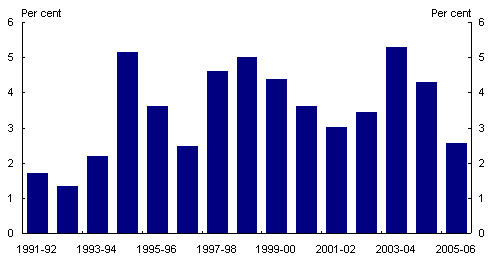
Household consumption growth moderated to 2.6 per cent in 2005-06, following strong growth in 2003-04 and 2004-05. The moderation in household consumption reflected sharp increases in petrol prices and an easing in growth of household dwelling wealth (reflecting the continued slow pace of house price growth), which were partly offset by strong household income growth.
Strong growth in household incomes and moderate consumption growth have seen households begin to strengthen their balance sheets. Budget measures in 2005-06, particularly changes to income tax, appear to have largely been saved by households rather than used to increase consumption.
Chart 8: Household consumption growth
Source: ABS 5204.0.
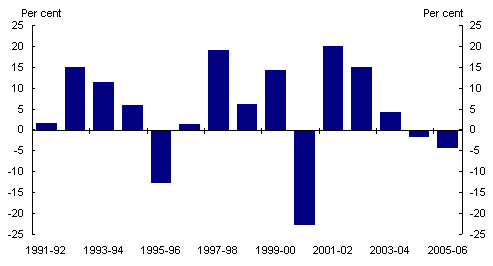
Dwelling investment fell by 4.1 per cent of 2005-06 compared to the Budget forecast fall of 3.0 per cent. This is a continuation in the mild downturn that began in 2004-05 after very strong growth in the early years of the decade. This downturn contrasts favourably with previous housing cycles, where downturns of over 10 per cent were common. Within the components of dwelling investment, both construction of new dwellings and alterations and additions fell in 2005-06.
Chart 9: Dwelling investment growth
Source: ABS 5204.0.
Forecasts and outcomes
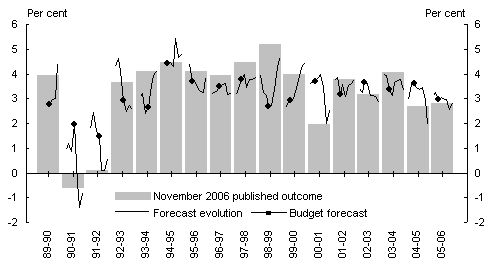
The 2005-06 Budget and MYEFO forecasts for real GDP were for growth of 3 per cent, compared to an outcome of 2.8 per cent. The forecast error of 0.2 per cent compares favourably with the average absolute error in Budget real GDP forecasts of 0.9 per cent between 1995-96 and 2003-04.5 Chart 10 compares the evolution of the forecasts for 2005-06 with past years.
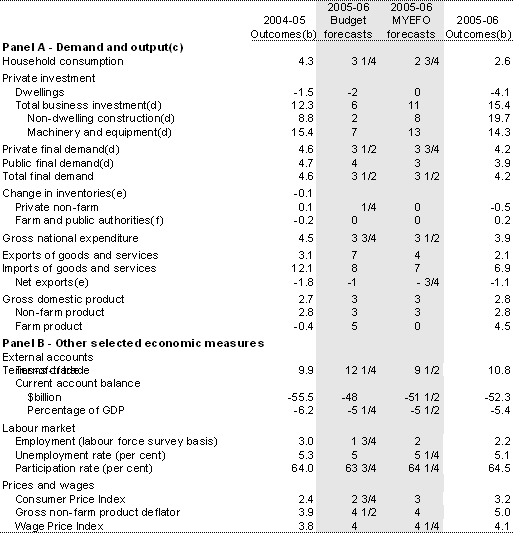
Table 1 shows the full details of the forecast performance. The key differences between the forecasts and outcomes for domestic demand and output are in the forecasts for consumption, business investment and exports.
Consumption moderated by more than expected in the 2005-06 Budget forecast, growing by 2.6 per cent compared to the forecast for growth of 3 per cent. However, while the absolute difference was small compared to other forecasts, the contribution to the overall error in the GDP forecast was significant.
Chart 10: Evolution of forecasts of growth of real GDP
Source: ABS 5204.0, Treasury forecasts.
Table 1: Domestic economy forecasts and outcomes for 2005-06(a)
- Percentage change on preceding year unless otherwise indicated.
- Calculated using original (that is, not seasonally adjusted) data.
- Chain volume measure.
- Excluding second-hand asset sales.
- Percentage point contribution to growth in GDP.
- Changes in inventories held by privatised marketing authorities are included with the inventories of the farm sector and public marketing authorities.
Source: Australian Bureau of Statistics (ABS) cat. no. 5204.0, 5302.0, 6202.0, 6345.0, 6401.0, unpublished ABS data and Treasury.
The boost to business investment from the high prices for mining commodities was considerably larger than that anticipated in the forecasts, dr
iving a significant portion of the overall divergence. The difference between the export forecasts and outcomes was due in part to the impact of cyclones on the exports of non-rural commodities.
The forecast for the CPI was significantly lower than the outcome, which largely reflects unanticipated higher fuel and fruit prices. The Budget forecasts also underestimated the strength of the labour market, particularly the participation rate.
1 This article is based on economic data released prior to 2 November 2006, including the Annual National Accounts for 2005-06.
2 The US fiscal year runs from 1 October to 30 September.
3 The Chinese investment boom is further discussed in ‘Reflections on the global economy and the Australian mining boom’ by David Gruen and Steven Kennedy in this issue of Economic Roundup.
4 See ‘Reflections on the global economy and the Australian mining boom’ by David Gruen and Steven Kennedy in this issue of Economic Roundup.
5 See Ewing, Gruen and Hawkins ‘Forecasting the macroeconomy’, Economic Roundup, Autumn 2005 for further details on Treasury’s macroeconomic forecasting performance.
