The framework follows that developed in Rothman, 2000 and Rothman, 2003. It uses Excel spreadsheets to compare the amounts accumulated at retirement after all taxes in two situations:
- the first where the person invests in the superannuation system with all its rules and taxes and;
- the second where the same person invests equivalent monies as available post income tax outside of the superannuation system, using the same investment portfolio as used for the superannuation investment.
We are trying to compare like with like and in so doing have to be careful. To make a sensible comparison we have to focus on pre tax money as the starting point. Say a person on an annual taxable income of $40,000 wants to invest $1000 of his or her pre tax earnings in superannuation. If he or she does this through an employer contribution (salary sacrifice), ignoring fees and charges, $850 will be working for them in the superannuation fund. If he or she invests through member contributions only $685 will be working for them, as full personal income tax at 31.5% (including the Medicare levy) needs to be paid first. Similarly the amount invested in the investment vehicle outside of superannuation is $685.
All cases are assumed to be within age contribution and RBL limits. We also take a conservative simplified framework which assumes all benefits are taken as a post preservation age ETP with the full 16.5% tax rate applicable above the ETP tax free threshold (where the threshold applies). We therefore somewhat understate the relative advantage of superannuation. Those who choose retirement income stream products will not pay ETP tax on these benefits and may also gain a 15% tax rebate; generally this will result in a higher standard of living in retirement than taking all benefits as an ETP (see Tinnion and Rothman, 1999).
In the analysis we consider two recent policy changes:
- The abolition of the superannuation surcharge; and
- The expanded co-contribution introduced from July 2004.
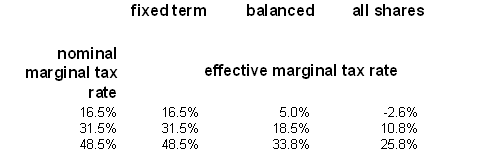
The analysis consists of two parts. Firstly we calculate for each nominal tax bracket the effective earning tax rate for a given portfolio and rate of return. For example for a person on 31.5% nominal marginal tax rate investing outside superannuation, the effective tax rate for fixed interest is 31.5%. Our simplified balanced portfolio consists of 40% fixed interest, 40% fully franked Australian shares and 20% international shares; for this balanced portfolio at a 7 per cent gross return, the effective marginal tax rate is 18.5% or 59% of the person’s nominal marginal tax rate. The reduction reflects the impact of franked dividends and the capital gains tax rules. Thus, if the person directly receives income from interest, dividend and nominal realised capital gains totalling $1000 the net tax payable after credits is $185. Table 1 below sets out the results of this preliminary step.
Table 1. Effective Marginal Tax Rate On Earnings From Investments, Outside Superannuation, various investment portfolios.
Given these effective tax rates, it is not difficult to create a spreadsheet calculator which accumulates the investment in both the within superannuation and outside superannuation tax environments and compares the results. While a considerable number of specific assumptions such as the composition and investment returns of the balanced portfolio have to be made to do the comparisons, sensitivity analysis varying the assumptions indicates that the pattern of results is quite robust.
We will use this framework to examine the relative advantage of superannuation for one off investments. We assume that the person will exceed the ETP tax free threshold over his/her working life and accordingly that the one off investment being considered will not benefit from the ETP tax free threshold. The comparisons assume like balanced portfolios for the within and outside superannuation investments.
For periods of investment from 1 year up to 20 years, Chart 1 shows the comparative advantage of employer superannuation at various surcharge rates. Projected accumulation balances at retirement are compared for one-off investments made within and outside superannuation, using the same balanced portfolio for both investments. The chart shows the percentage advantage of the accumulation within superannuation compared to the outside alternative.
For both tax brackets there is a large improvement because of the surcharge rate changes, growing as the period of investment increases. The Chart also shows clearly that there is great advantage in voluntary employer superannuation even when there is only a short time to retirement. With the removal of the surcharge, for a person with a marginal tax rate of 48.5%, investing an additional sum only one year out from retirement yields an available sum after taxes over 40% greater than taking the equivalent sum as wages and investing outside superannuation. For a person with a marginal tax rate of 43.5% the advantage is around 28%. These advantages would be even higher if the sum were invested in a pension at retirement.
Chart 1
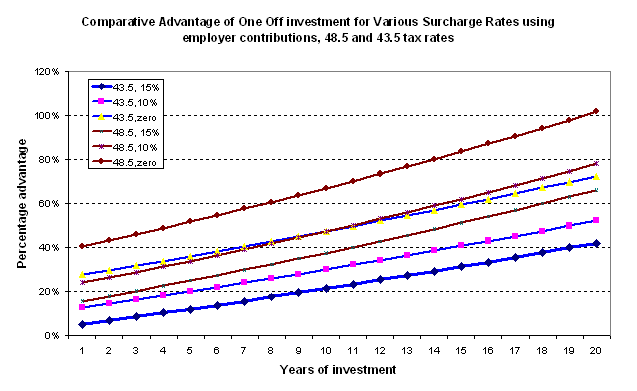
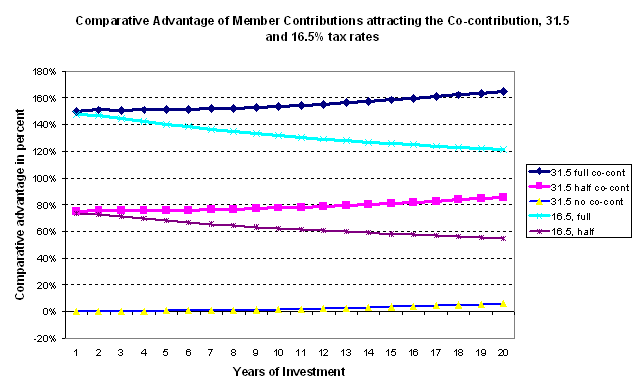
Chart 2 shows the dramatic potential impact of the Government’s co-contribution policy which, adds up to a maximum of $1500 (tax free) to the superannuation accounts of those eligible (see Attachment C for details). The examples shown should be taken as illustrative only: the exact extent of advantage will vary by the amount contributed. In the examples shown the cases marked ‘full’ contribute $1000 of after tax money and receive the full $1500 co-contribution, or a lesser amount which attracts the 150% government contribution in full. In the examples marked as ‘half’, half the amount contributed as a member contribution attracts the co-contribution. For comparison, a case where no co-contribution applies is also shown though in such a case using salary sacrifice would be more tax effective. The levels of comparative advantage in Chart 2 can clearly exceed those available in Chart 1 even after the surcharge has been abolished in full.
Chart 2