The forecasts for the domestic economy are underpinned by several technical assumptions. The exchange rate is assumed to remain around levels at the time the forecasts were prepared (a trade-weighted index of around 70 and a $US exchange rate of around 92c). Interest rates are assumed to rise in line with market expectations over the forecast period. World oil prices (Tapis) are assumed to remain at around $US79 per barrel. The farm sector forecasts are based on an assumed return to average seasonal conditions over the remainder of the forecasting period.
Household consumption
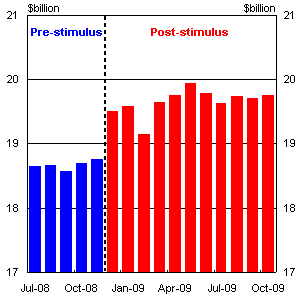
The outlook for household consumption has strengthened since MYEFO. Retail sales are holding up despite the unwinding of stimulus, and consumer confidence is better than expected given recent increases to interest rates. Motor vehicle sales have also increased in the quarter.
Share market values and house prices have continued to strengthen in the quarter. These gains have continued the upward movement in household wealth, and have also helped sustain consumer confidence.
Household consumption grew by a solid 0.7 per cent in the September quarter, while the March and June quarter outcomes were revised down slightly.
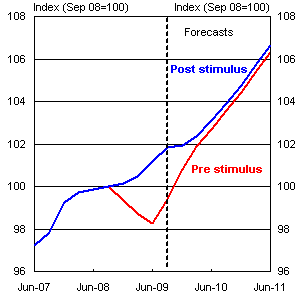
Consumption is expected to be subdued in the short term as the effect of temporary cash payments continues to subside before returning to trend growth rates in early 2010.
Forecasts for household consumption in 2009-10 have been revised up from a ¾ per cent increase at MYEFO to growth of 1¾ per cent. Consumption growth in 2010-11 is expected to be slightly higher than MYEFO, at 3 per cent.
Chart 1: Retail trade
Source: ABS Cat. No. 8501.0.
Chart 2: Effect of stimulus on consumption
Source: ABS Cat. No. 5206.0 and Treasury.
Dwelling investment
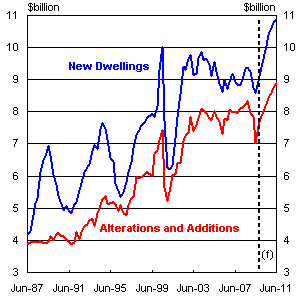
The near term outlook for housing construction remains largely unchanged since MYEFO. Dwelling investment rebounded strongly in the September quarter (up 5.9 per cent), after three consecutive quarterly declines. Recent housing finance and building approvals data indicate that activity will gain further momentum in coming months. Residential approvals are now 11.7 per cent higher than a year ago and are back to around pre-crisis levels. Detached houses will lead the recovery with private house approvals rising for the past ten months.
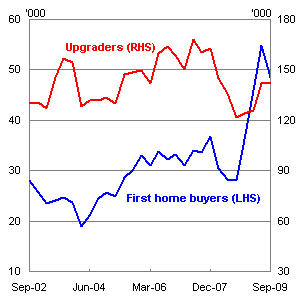
While the First Home Owners Boost is approaching its end, there are early signs of upgraders coming back into the market. Low mortgage interest rates, improved household confidence and a more promising employment outlook will continue to attract investment in the sector (Chart 3).
Chart 3: Housing Finance
Source: ABS Cat. No. 5609.0
Strong population growth and a sluggish supply response in recent years appear to have led to substantial excess or pent-up demand. In the longer term, these factors are expected to support the housing sector. However, the prospect of higher interest rates is expected to slightly moderate growth in 2010-11. Dwelling investment is forecast to grow 11 per cent in 2010-11 compared to 12 per cent growth in MYEFO.
The risks identified at the time of the MYEFO are still present. On-going credit constraints, particularly in relation to medium and high density developments, continue to pose a downside risk to investment. In addition, higher interest rates could have a larger than expected impact on investment in 2010-11.
Chart 4: Private Dwelling investment (real)
Source: ABS Cat. No. 5206.0 and Treasury.
Business investment
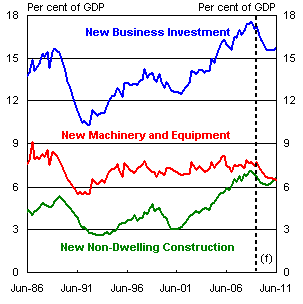
New business investment is expected to fall by 4 per cent in 2009-10 before recovering in 2010-11, growing by 5 per cent. Forecasts for 2009-10 have increased from the MYEFO as a result of continuing improvement in business confidence and the effects of the Government's Small Business and General Business Tax Break. (Chart 5)
Business conditions and sentiment have improved further over recent months with business confidence currently at a seven-year high. The significant rise in confidence is starting to be matched by improvements in measures of business conditions, which have returned to levels recorded in early 2008. Business surveys have also reported an improvement in investment intentions off the very low levels recorded earlier in the year. However, current survey results imply little, if any, real growth over the coming year. As business conditions recover further and current spare capacity is absorbed, investment is expected to bounce back in 2010-11.
Chart 5: Business investment to GDP ratio (nominal)
Source: ABS Cat. No. 5206.0 and Treasury.
Forecast investment in new machinery and equipment is stronger than the September round, reflecting higher CAPEX intentions in the September quarter release and the continued strong take up of the Government's investment incentives. While CAPEX intentions for 2009-10 have improved, they still imply negative investment growth for the year. Investment is now expected to fall by 5 per cent in 2009-10, before growing by 5½ per cent in 2010-11.
New engineering construction investment is expected to increase by 5 per cent in 2009-10, followed by a strong increase of 18 per cent in 2010-11. The updated forecasts reflect revised assumptions for the expected expenditure profiles of major projects in the forecast horizon. Estimates will continue to be refined as a clearer understanding of the timing of expected investment comes to hand. With strong growth potential in the oil and gas sector and a number of other major resource projects in the pipeline, engineering construction investment is expected to grow significantly as a share of total business investment over coming years.
Non-residential building investment is expected to fall by 17½ per cent in 2009-10 and by 9 per cent in 2010-11. The overall fall in investment over the forecast horizon is broadly in line with the MYEFO forecast. However, investment in 2009-10 is now expected to decline at a slower rate as a result of revised assumptions about the impact on private sector activity under the Building the Education Revolution program. Outside of the education sector, investment will remain very weak reflecting the extremely low level of private non-residential building approvals, credit constraints, weak commercial property prices and higher vacancy rates.
Public final demand
Public final demand is expected to grow by 7 per cent in 2009-10 and by 1½ per cent in 2010-11. Compared to the forecast of the MYEFO, the forecast for 2009-10 is slightly lower, while the forecast for 2010-11 is 1 per cent higher.
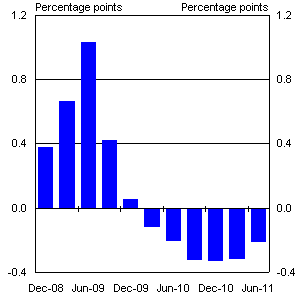
The Government's stimulus packages continue to play a crucial role in supporting the overall level of activity in the economy. The contribution of stimulus to GDP growth peaked in the June quarter 2009 and will have a declining influence thereafter, subtracting from growth from the March quarter 2010 (Chart 6). The quarterly profile has been revised since MYEFO reflecting updated estimates from jurisdictions on the profile of stimulus spending.
Chart 6: Contribution of fiscal stimulus to GDP growth
Source: ABS Cat. No 5206.0 and Treasury.
Exports, imports and the current account deficit
Export volumes have remained remarkably resilient throughout the global downturn, driven in particular by demand for Australia's commodities.
Total export volumes are forecast to grow modestly in 2009-10. This reflects the anticipated recovery in the global economy, which will see export volumes strengthen further in 2010-11, growing by 5½ per cent.
The Chinese government's infrastructure focused stimulus package has continued to support demand for Australian coal and iron ore. Steel production and bulk commodity demand in the rest of the world are also beginning to show signs of recovery. However, exports of other ores and metals have declined over recent months and demand is expected to be subdued in the short run, reflecting lower Chinese demand for imports.
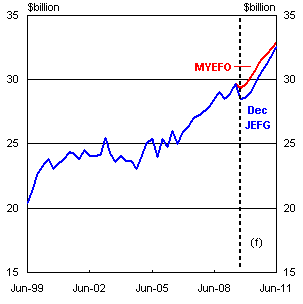
As such, non-rural commodities are expected to fall by ¼ of a per cent in 2009-10. Strong growth is forecast for 2010-11, reflecting a stronger outlook for world commodity demand and an expected increase in Australian iron ore production capacity.
Farm production is expected to grow by 2 per cent in 2009-10, as better than expected rainfall patterns in some parts of the country have improved forecasts for rural output.
Stronger world growth has improved the outlook for elaborately transformed manufactures (ETM) and services exports. While ETM exports are expected to contract by 5½ per cent in 2009-10, this is an improvement on the MYEFO forecast. This improvement is influenced, in part, by information from business liaison which point to an enhanced export outlook, consistent with the improved outlook for global growth. ETM export volumes are forecast to recover in 2010-11, growing by 1½ per cent. Ongoing strength in education exports and a resilient inbound tourist market are expected to increase services exports by 3½ per cent in 2009-10. Services exports will continue to grow in 2010-11 as the outlook for the global economy improves.
Forecasts for goods and services imports in 2009-10 are significantly stronger than at MYEFO, growing by 6 per cent in 2009-10 as domestic demand continues to improve and in view of the stronger Australian dollar. Imports are expected to increase by a further 8 per cent in 2010-11.
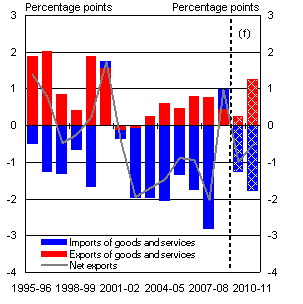
Net exports are expected to detract 1 percentage point from GDP growth in 2009-10, a more substantial subtraction than at MYEFO, as a result of stronger import volumes. Net exports are expected to detract ½ of a percentage point from growth in 2010-11 as import volumes continue to grow faster than export volumes.
Chart 7: Net exports - contribution to GDP growth
Source: ABS Cat. No. 5206.0 and Treasury.
Chart 8: Non-rural commodities
(CVM)
Source: ABS Cat. No. 5206.0 and Treasury.
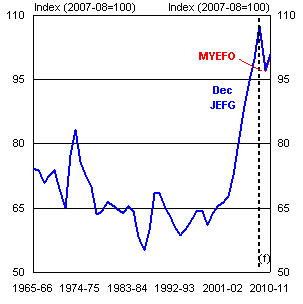
The terms of trade are forecast to decline by 9½ per cent in 2009-10. While contract prices for Australia's bulk commodities have fallen as expected, they are forecast to rise in 2010 in line with growing world demand. Correspondingly, the terms of trade are forecast to increase by 4 per cent in 2010-11. Recent developments in commodity markets suggest that there is some upside risk to these forecasts.
Chart 9: Terms of Trade
Source: ABS Cat. No. 5206.0 and Treasury.
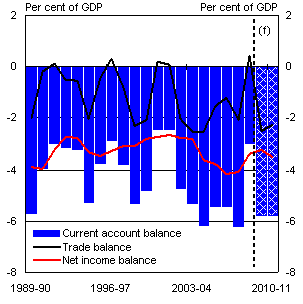
The forecast for the current account deficit (CAD) has increased since MYEFO to 5¾ per cent of GDP in 2009-10 and 2010-11. This largely reflects a widening trade deficit resulting from stronger imports growth as the domestic economy recovers. The net income deficit (NID) is expected to widen in 2010-11, to 3½ per cent of GDP, as the improved outlook for Australia's export earnings and stronger commodity prices result in equity income outflows.
Chart 10: Current Account Deficit
Source: ABS Cat. No's. 5206.0, 5302.0 and Treasury.
Employment, wages and inflation
The employment outlook has improved in line with the stronger outlook for the economy.
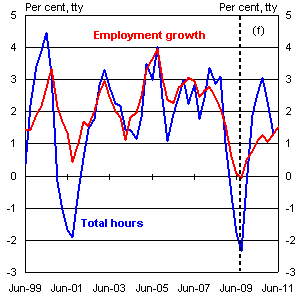
Since MYEFO, the outlook for the labour market has improved. This reflects stronger than expected employment growth, with almost 100,000 jobs created in the past three months. This has been driven by an increase in full-time employment, which accounted for around 70 per cent of the increase in employment. Employment is expected to grow by 1 per cent through the year to the June quarter 2010, stronger than the growth of ¼ per cent forecast in MYEFO.
Hours worked have also been increasing, with trend aggregate hours rising for five consecutive months. A recovery in average hours of employees is expected as labour market conditions begin to improve.
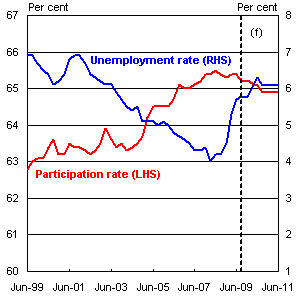
A more positive outlook for employment is expected to result in a lower peak unemployment rate than forecast at MYEFO. The unemployment rate is expected to peak in the June quarter 2010 at 6¼ per cent. This is a more subdued rise than the peak of 6¾ per cent in the June quarter 2010 forecast at MYEFO.
In contrast with previous downturns, the participation rate has held up during the current downturn. The increased employment opportunities offered by a stronger than expected labour market are anticipated to result in a more moderate fall in the participation rate than forecast at MYEFO with fewer discouraged workers expected to leave the labour force.
Chart 11: Employment growth and total hours (sa)
Source: ABS Cat. No 6202.0 and Treasury.
Chart 12: Unemployment and Participation Rates (sa)
Source: ABS Cat. No. 6202.0 and Treasury.
The outlook for earnings is broadly unchanged from MYEFO, with moderate wages growth forecast in line with excess capacity in the labour market expected over the forecast period.
The National Accounts measure of Average Weekly Earnings fell in both the March and June quarters, driven by declining average hours worked and cuts in bonuses. As the recovery takes hold, a resurgence in average hours worked is expected to support earnings growth over the near term.
A weak September quarter result, accompanied by downward pressure from the Australian Fair Pay Commission's zero increase in minimum wages suggest that growth in the WPI will continue to slow in through-the-year terms for the remainder of 2009, before levelling off in 2010. The WPI is expected to grow by 3¼ per cent and 3½ per cent through the year to the June quarters 2010 and 2011, unchanged from the MYEFO forecasts.
Headline and underlying inflation forecasts have been upgraded marginally since MYEFO, largely as a result of stronger than expected September quarter outcomes. Headline and underlying inflation are now expected to grow by 2½ per cent through the year to the June quarter 2010, up slightly from the 2¼ per cent forecast at MYEFO, and 2¼ per cent through the year to the June quarter 2011.
The headline CPI increased by 1.0 per cent in
the September quarter 2009 to be 1.3 per cent higher through the year. The result was largely driven by increases in the prices of utilities, automotive fuel, house purchases and deposit and loan facilities. Over the next few quarters headline inflation is expected to move into the target band of 2 to 3 per cent and remain there for the rest of the forecast period.
Underlying inflation, which responds with a lag to economic activity, is expected to continue to moderate over the forecast period in line with ongoing spare capacity in the economy. This is consistent with growth in labour costs and import prices - key drivers of underlying inflation - which are expected to continue to moderate over the next few quarters.