Key points
The Australian economy and the global economy both continue to grow strongly at the same time as we cut pollution to reduce the risks of dangerous climate change.
Early global action is cheaper than delayed action. Every year of delay adds to the eventual cost of action as it locks in more emission-intensive industry and infrastructure, and defers new investment in low-emission technology, industry and jobs.
Pricing carbon will drive structural change in the economy, moving resources towards less emission-intensive industries. Many of Australia's industries will maintain or improve their competitiveness in a carbon constrained world.
The structural change in the economy driven by a market-based carbon pricing mechanism will be modest compared to other changes facing the economy, such as those driven by the high terms of trade, demographic change or changing consumer tastes.
Modelling of scenarios with two different starting carbon prices in 2012-13 (A$20 and A$30 per tonne of carbon dioxide equivalent) shows the economy continues to grow strongly, while cuts to carbon emissions are deep.
Growth in real national income per person slows by about one-tenth of one percentage point per year under carbon pricing, with real incomes around $9,000 higher in 2020 in today's dollars.
Jobs will continue to grow under carbon pricing. By 2020, national employment is projected to increase by 1.6 million jobs, with or without a carbon price.
Household consumption continues to grow over time, although households face higher prices for emission-intensive products, such as electricity and gas. The impact on overall price levels is modest.
The analysis provides information on only one element necessary for evaluating climate change policy: the costs of taking action. To form policy judgements, this modelling analysis needs to be evaluated alongside the detailed analysis of the economic, environmental and social impacts of climate change itself and the benefits of reducing global emissions.
The modelling is robust to a range of assumptions. Sensitivity analysis shows that the aggregate economic costs are similar across a range of plausible assumptions.
The level of Australia's real income per person in 2020 is now expected to be higher after allowing for carbon pricing than was expected without a carbon price in the 2008 modelling. The key economic outcomes from the current modelling are similar to the analysis published in 2008.
Introduction
Evidence that the globe is warming is unequivocal, and has become stronger since the 2008 modelling exercise. There is clear scientific advice that the climate is changing, that greenhouse gas emissions from human activity are a major cause and that we can avoid the worst impacts by reducing emissions.
As global emissions rise, the stock of emissions in the atmosphere grows. Since the industrial revolution, when fossil fuel combustion began driving economic growth, global atmospheric concentrations of greenhouse gases have increased markedly. The current concentration of carbon dioxide, the most significant anthropogenic greenhouse gas, is estimated to be around 390 parts per million (ppm), far exceeding the range of variation over the past 800,000 years. Without action to reduce emissions, concentration levels are estimated to rise to around 1,500 ppm carbon dioxide equivalent (CO2-e) by 2100, resulting in high risks of large-scale irreversible climate change.
This report examines different scenarios in which Australia and the world take action to reduce emissions so atmospheric concentrations of greenhouse gases are stabilised at levels that reduce the risks of dangerous climate change. It updates and expands on the analysis undertaken for the Government's Australia's low pollution future: the economics of climate change mitigation released in October 2008.
The analysis provides information on only one element necessary for evaluating climate change policy: the costs of taking action. To form policy judgements this modelling analysis needs to be evaluated alongside the detailed analysis of the economic, environmental and social impacts of climate change itself and the benefits of reducing global emissions; that analysis has been provided elsewhere (Garnaut, 2008; Pearman, 2008; Stern, 2007; OECD, 2009; OECD, 2010; and CCSP, 2007). The strong consensus emerging from this work is that the costs of inaction far outweigh the costs of action on climate change.
The Treasury has once again undertaken a comprehensive modelling exercise using a suite of models comparable to that undertaken in 2008 to inform discussion about the costs of taking action on climate change. The impacts of carbon pricing are assessed at the international, national, state, industry and household levels.
Two international global action scenarios, assuming the world takes action to stabilise greenhouse gas concentration levels at around either 550 ppm or 450 ppm by around 2100, provide a credible and realistic backdrop to examine the impact of pricing carbon in Australia.
The core policy and high price scenarios assume that Australian emissions will face different prices (A$20 and A$30) from 1 July 2012, which rise at a fixed rate each year, before the introduction of a flexible price cap-and-trade scheme on 1 July 2015.
Australia's national emission reduction targets of at least 5 per cent below 20001 levels by 2020 and 80 per cent below 2000 levels by 2050 are modelled. As part of a plan to secure a clean energy future, the Australian Government has adopted a stronger long-term target for cutting pollution. The Government's 2050 target represents a fair contribution by Australia to the global goal of holding temperature increases to less than 2 degrees Celsius, and is consistent with the target adopted by countries such as the United Kingdom.
The key message from the modelling is that the economy continues to prosper while emissions are reduced.
This report adds to the large body of analysis that shows that the economic cost of taking action to reduce emissions is modest, if action starts sooner rather than later (OECD, 2008; OECD, 2009). Delayed action only raises the eventual economic costs.
The Australian economy is flexible and able to adapt to carbon pricing, just as it has evolved in light of other economic developments. It will adjust over time to a low-emission world through changes in technology, processes, production inputs and consumer choices. As the economy transitions, the impact of carbon pricing on economic growth declines.
The modelling is robust to a range of assumptions. Sensitivity analysis shows that the aggregate economic costs are similar across a range of plausible assumptions.
As the world takes action
The broad sectoral trends in the global economy continue as the world acts on climate change. The services sector continues to comprise a growing share of the global economy, and agriculture and energy-intensive industries continue to comprise declining shares. However, reducing global emissions requires a shift away from the production of emission-intensive goods towards low-emission goods, combined with a general decline in the emission intensity of production across all sectors.
Under both global action scenarios, the world economy will continue to prosper, with average annual growth slowed by only around 0.1 of a percentage point over the period to 2050 while reducing emissions to stabilise greenhouse gas concentration levels at around either 550 ppm or 450 ppm of CO2-e by around 2100. Even with strong action on climate change, the global economy grows strongly with world output more than 3.5 times higher by 2050 than today.
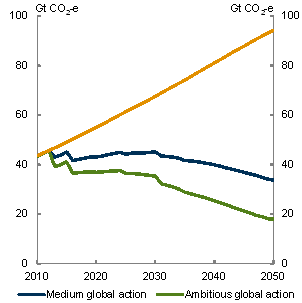
The medium global action scenario assumes countries implement the less ambitious end of their mitigation pledges made in the Cancun Agreements and Copenhagen Accord, and stabilise greenhouse gas concentrations at 550 ppm by around 2100.
The ambitious global action scenario reflects a potential trajectory that gives around a 50 per cent chance of achieving the global goal of holding the average temperature increase to less than 2 degrees Celsius. Greenhouse gas concentrations are stabilised at 450 ppm by around 2100.
Delaying mitigation action at the global level would increase climate change risks, lock in more emission-intensive industries and infrastructure, and defer cost reductions in low-emission technology. This would increase the cost of achieving environmental goals.
Delay brings initial benefits, but every year of global delay adds to the eventual economic and social cost of tackling climate change. Delaying global action by 3 years adds around 20 per cent to the first year global mitigation cost. Delaying entry by a further 3 years adds a further 30 per cent to the first year mitigation cost.
World carbon prices are expected to be around A$29 in 2016, if the world takes action to stabilise greenhouse gas concentration levels at 550 ppm of CO2-e. If the world takes action to stabilise concentration levels at 450 ppm of CO2-e, world prices are expected to be A$61 in 2016. These price ranges are slightly lower than in previous Treasury modelling, with higher world prices offset by an initially higher Australian dollar.
World carbon prices are predicted to be slightly higher than in the 2008 modelling for more ambitious action. Delayed and less coordinated international action on climate change pushes up world prices needed to achieve the same environmental outcome, raising mitigation costs. While the global financial crisis slowed emissions growth in developed countries, growth in developing countries' emissions is now projected to be stronger, pushing up world price estimates. Projections of higher energy prices lead to lower world carbon prices as a partial offset.
Independent of Australian action, world action to reduce emissions has a small negative impact on the Australian economy, through reduced demand for our exports, including energy exports such as coal and gas. If the world acts to achieve a 550 ppm stabilisation goal, this is expected to reduce Australia's gross national income (GNI) growth by less than 1/20th of one percentage point per year over the period to 2050.
Chart 1: Gross world product and emissions
Gross world product
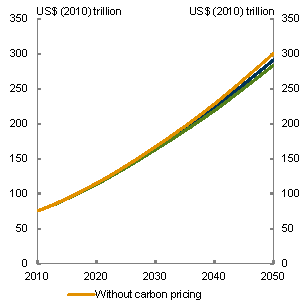
Emissions
Source: Treasury estimates from GTEM.
Before domestic carbon pricing
The global action scenarios model the path of our economy before accounting for the impacts of a domestic price on carbon. They separate the impact of the domestic carbon price from the other forces at work in our economy.
The global action scenarios tell a story of an economy that will continue to grow, generating jobs and income growth. It is also a story of an economy that is already managing ongoing and substantial structural change from factors like demographic change and the high terms of trade.
Gross national income per person is expected to grow at an annual rate of 1.2 per cent to 2050. While aggregate growth is projected to be strong, growth across sectors and industries will vary, with strongest growth in absolute terms in the services sector and strongest growth in percentage terms in mining and related sectors over the next decade.
Also over the next decade, the output of the services sector — industries like education, health, finance, professional services, information and communication technology, recreation, retail and wholesale — increases by around a third, owing to the growing demand from a more prosperous Australia and its surrounding region.
The manufacturing sector grows at a slower rate than the rest of the economy — around ½ per cent annually to 2020 — as Australia's economy continues the long-term shift towards services and the relative decline of manufacturing. This long-term decline is expected to be reinforced by the effects of the sustained high terms of trade and high exchange rate. While the manufacturing sector will be larger in absolute terms by 2020, its share of GDP will continue to fall from its peak, when it accounted for one quarter of our 1950s economy.
Mining output grows at a real annual rate of around 6 per cent and construction output by 4 per cent to 2020.
While Australia's terms of trade are now expected to remain higher for longer, boosting the level of incomes, they are still expected to fall gradually from their current 140 year high as the global supply of key Australian export commodities expands.
The level of Australia's GNI per person in the reference scenarios is expected to be around 4½ per cent higher in 2020 than in the previous 2008 modelling. Growth in GNI per person over the period is expected to be around 1.2 per cent per year, slower than growth in GDP, reflecting the expected fall in the terms of trade.
With domestic carbon pricing
The Australian economy will continue to prosper while cutting carbon emissions.
Pricing carbon results in deep cuts in domestic greenhouse gas emissions relative to the global action scenarios. It breaks the link between economic growth and emissions growth, so large cuts in emissions do not result in large economic costs. Through a market-based mechanism, individuals and firms are encouraged to adopt cleaner technology and substitute from more to less emission-intensive production, goods and services.
Australia's GNI per person grows strongly under both carbon price scenarios — core policy and high price — at rates marginally below those expected without carbon pricing.
In the medium global action scenario, where the world takes action to limit greenhouse gas concentrations to 550 ppm, but with no Australian carbon price, Australian GNI per person is around 60 per cent higher and emissions are 74 per cent higher by 2050 than today. In contrast, with carbon pricing, Australia's GNI per person is at least 56 per cent higher than today and emissions fall by around 80 per cent (with just over half the reduction occurring within Australia, and the remaining reduction being sourced from overseas).
Pricing carbon is expected to slow Australia's average GNI per person growth by less than 0.1 of a percentage point per year in the core policy scenario. Real GNI per person is expected to increase from today's levels by around $9,000 per person to 2020 and more than $30,000 per person to 2050.
Employment is projected to grow strongly with a carbon price. In the core policy scenario, around 1.6 million jobs are projected to be created to 2020 and a further 4.4 million to 2050. With a carbon price, growth in real wages, household consumption and investment slows slightly, consistent with the aggregate slowing in the economy.
Chart 2: GNI per person and emissions
GNI per person
Emissions
Source: Treasury estimates from MMRF.
Projections of any sort, particularly those over long timeframes, are inherently uncertain. The sensitivity analysis in this report shows the high level results are robust to a range of plausible alternative assumptions. The high level results are also consistent with a large body of analysis that suggests that the economic cost of taking action to reduce emissions is modest, if action starts sooner rather than later (OECD, 2008; OECD, 2009). Uncertainty about the modest economic costs of mitigation is not a reason to delay climate change action.
Decoupling growth and emissions
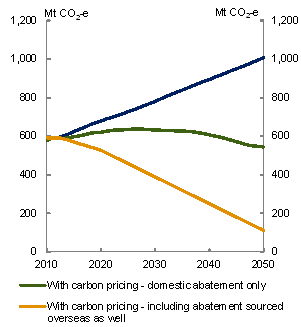
Australia's abatement task is substantial. Without a domestic carbon price, Australia's emissions are projected to increase along a strong upward trajectory. Australia's emissions reach 679 Mt CO2-e in 2020 (22 per cent above 2000 levels) and 1,008 Mt CO2-e in 2050 (82 per cent above 2000 levels) for a 550 ppm global stabilisation target. To meet the Australian Government's unilateral emission reduction targets, the abatement task is 159 Mt CO2-e in 2020. This excludes abatement from the Carbon Farming Initiative, as without a domestic carbon price, CFI abatement is exported or used in voluntary markets and therefore cannot be counted towards Australia's abatement task.
Across the scenarios, Australia's targets are met by reducing emissions within Australia and in other countries. While pricing carbon cuts emissions, it is much more expensive to meet the whole abatement task domestically. Sourcing emission reductions in other countries plays an important role, encouraging reduction in global emissions at the lowest economic cost.
The rate at which carbon prices reduce emissions varies, depending on which technologies become viable at different carbon prices. For example, the impact of a $1 increase in the carbon price will vary depending on the assumptions about the costs of low-emission technologies, such as carbon capture and storage technology or electric cars.
All sectors of the economy contribute to reducing emissions and can do so cost effectively. The greatest reductions occur in the electricity sector, as more renewable energy and gas are used to generate electricity, and coal fired generation declines.
Under carbon pricing, the structure of the economy shifts to lower emission activities, with carbon-intensive activities growing less rapidly and those activities offering low cost opportunities to reduce emissions growing faster. This restructuring makes most of the contribution to emission reductions.
Chart 3: Sources of emission reductions under the core policy scenario
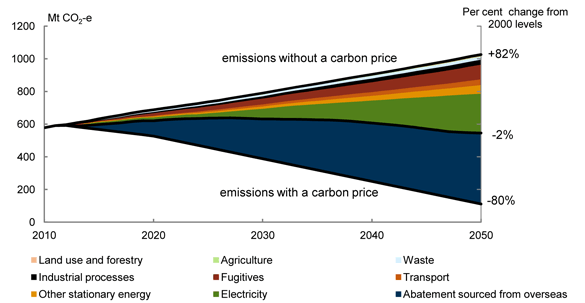
Note: Abatement from the carbon farming initiative is included in emissions without carbon pricing.
Source: Treasury estimates from MMRF.
The economy transitions
The structure of the Australian economy is always changing. The jobs of the future will be in different industries than those of the past. This will be true with or without carbon pricing.
Taking advantage of economic opportunities in new areas and the cheapest abatement options will require a reallocation of resources across the economy. A market-based mechanism is best placed to achieve this transition, and at lower cost. Industries that provide low cost opportunities to reduce emissions will see the largest positive impacts from carbon pricing.
The shifts in jobs between industries caused by pricing carbon will be small compared to those caused by ongoing technological change and income growth. They will also be small compared to the usual churning of employment between firms and industries every year. For more than 95 per cent of the economy, pricing carbon produces changes in employment, up or down, of no more than 1 per cent, by 2020. Real wage growth continues, although at a slightly slower rate.
The modelling looks at the whole-of-economy effects of carbon pricing. While aggregate economic costs are small, they vary across regions and sectors, reflecting changes in Australia's comparative advantage in a low-emission world. Precise impacts vary depending on the emission intensity of a state, region or sector, and the opportunities to diversify into low-emission goods and production processes. Regions heavily reliant on emission-intensive sectors, such as some resource processing and emission-intensive manufacturing, may be the most strongly affected over the longer term.
The economic cost of domestic carbon pricing is estimated to be slightly higher than in the 2008 modelling. This reflects the reduced coverage of the modelled policy compared to previous assumptions, resulting in less domestic abatement, and the higher cost of purchasing overseas permits in the later years. Delayed and less coordinated global action also contributes to the increased cost.
Living standards continue to improve
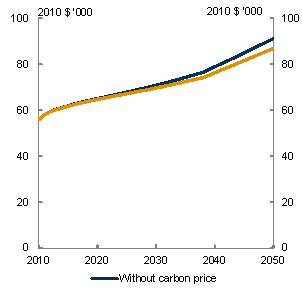
Living standards will continue to improve over time. Real GNI per person increases at an average annual rate of around 1.1 per cent in the core policy scenario compared to 1.2 per cent in the global action scenarios. By 2050, this results in income levels, with carbon pricing, that are around 1½ times current levels.
Carbon pricing will change the relative prices of goods and services and there will be an initial increase in the level of consumer prices. An initial impact will occur in 2012-13 with the introduction of the price, with a smaller step up in 2015-16, when the scheme moves to the international carbon price. For the core policy scenario, carbon pricing is estimated to raise the overall consumer price level by 0.7 per cent in 2012-13 and by a further 0.2 per cent in 2015-16, for a total of 0.9 per cent in 2015-16. Beyond 2015-16 there will be minimal implications for ongoing inflation.
Under the core policy scenario, average weekly expenditure will be higher by around $9.90 in 2012-13, of which electricity accounts for around $3.30 and gas around $1.50.
Real household income and living standards will continue to grow, despite higher prices for emission-intensive goods and services, particularly electricity and gas. As consumers respond to carbon pricing, many will find ways to reduce their relative consumption of emission-intensive goods, mitigating the effects.
Chart 4: CPI impact from carbon pricing compared with history
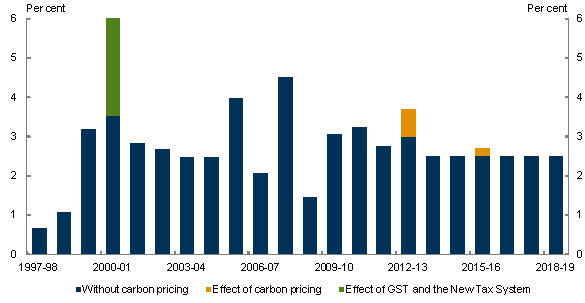
Source: Treasury estimates from PRISMOD.
Industries evolve
Australian output from emission-intensive, trade-exposed industries generally continues to grow but at a slightly slower rate. Output of iron and steel manufacturing, alumina and chemical production and refineries are all projected to continue to grow in the long term, but at a slightly slower rate of growth than in the global action scenarios.
The agriculture sector, which is excluded from the carbon price, continues to grow and has an incentive to reduce emissions through the Carbon Farming Initiative.
Allocation of some free permits to emission-intensive, trade-exposed industries will shield them from much of the effects of carbon pricing in the transition to a clean energy economy. This will slow the transition of resources out of these sectors and into other parts of the economy. In the long term, a gradual change in the structure of the economy is necessary to achieve Australia's emission targets at minimum cost.
Low-emission, trade-exposed industries benefit from carbon pricing. These industries include motor vehicle and parts production, textiles, clothing and footwear and food manufacturing.
The biggest transformations occur in the electricity sector
The carbon price drives significant changes in the mix of fuels and types of technology used to generate electricity in all the policy scenarios. A carbon price makes renewable generation more competitive relative to coal, leading to a transition away from conventional coal-fired generation towards renewable technology.
The electricity sector is the largest source of emission reductions. Instead of emissions growing by over 60 per cent by 2050 in the global action scenarios, emissions decline by around 60 per cent in the core policy scenario.
Emission reductions are a result of slower growth in electricity demand as well as substitution towards cleaner technologies. At higher carbon prices, the transition to cleaner electricity generation occurs faster.
Electricity demand is an important source of abatement in the early years, comprising over 40 per cent of the cumulative abatement to 2020. By the mid 2030s carbon capture and storage is projected to be commercially viable and plays a significant role in further de-carbonising the electricity generation sector.
The modelling shows that carbon pricing will reduce the profitability of some coal generators, eventually leading to the retirement of some of the most emission-intensive power plants (though there is great uncertainty about the timing of retirements). However, carbon pricing will also make existing lower emission generators, such as gas generators, more profitable.
The modelling is robust to a range of assumptions. Sensitivity analysis shows that the emissions from electricity generation will fall significantly under a range of plausible technology and commodity price assumptions. Uncertainty about the future is a key reason why market-based mechanisms result in better outcomes.
The carbon price leads to an average increase in household electricity prices of 10 per cent over the first five years of the scheme. This is a modest increase in the context of the 40 per cent real increase in electricity prices over the past 5 years.
Chart 5: Electricity generation mix, core policy scenario
Electricity generation mix
Renewable energy mix
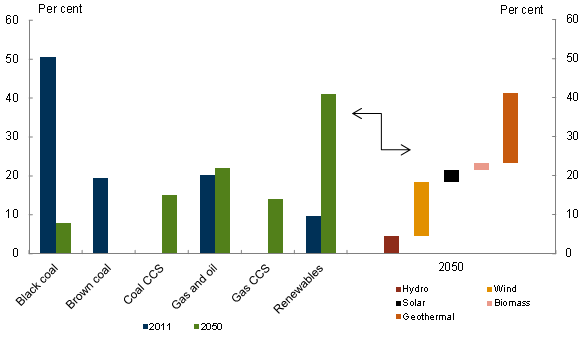
Source: Average of SKM MMA and ROAM.
Table 1: Headline Australian indicators
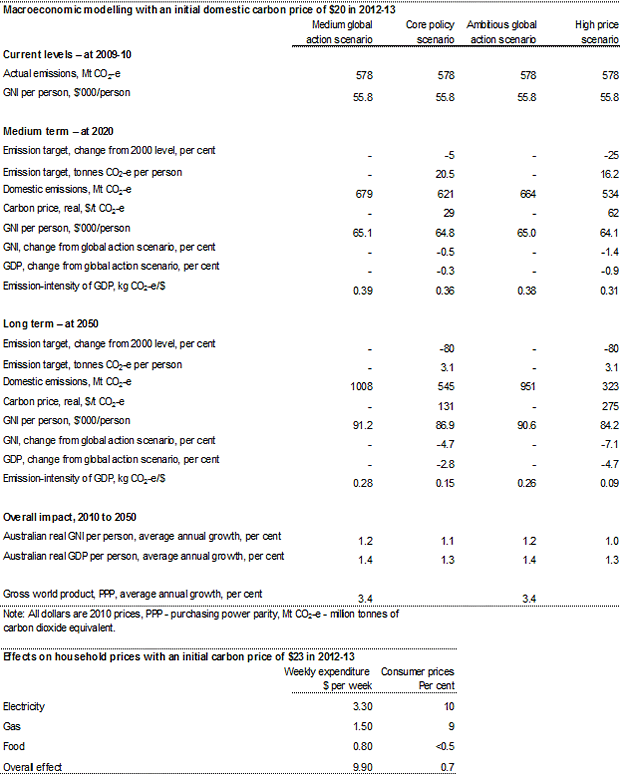
Source: Treasury estimates from MMRF, GTEM and PRISMOD.
1 All results in this publication, unless otherwise indicated, are in Australian financial years, ending 30 June of the year quoted.