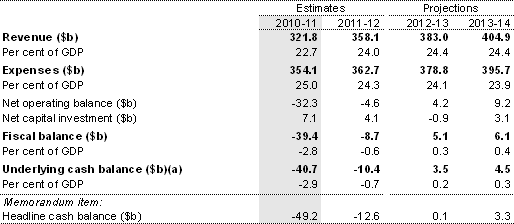
An underlying cash deficit of $40.7 billion (or 2.9 per cent of GDP) is estimated for 2010-11. A fiscal deficit of $39.4 billion (or 2.8 per cent of GDP) is estimated for 2010-11. The fiscal outlook is for a continuing reduction of underlying cash and fiscal deficits until a forecast return to surplus from 2012-13. This is consistent with the outlook published in the 2010-11 Budget and the Economic Statement.
Table 3 provides a summary of the major budget aggregates.
Table 3: Australian Government general government sector budget aggregates

(a) Excludes expected Future Fund earnings.
Underlying cash balance estimates
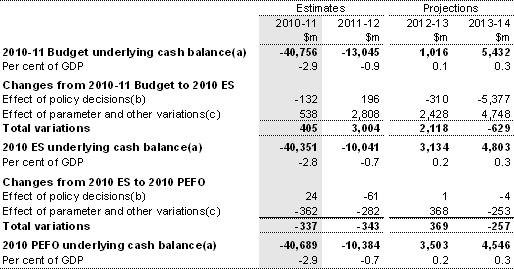
Policy decisions taken after the 2010-11 Budget and up to the Economic Statement reduced the underlying cash balance by $132 million in 2010-11 and by $5.6 billion over the forward estimates (including $7.5 billion from changes to the resource tax arrangements).
Policy decisions reported in the PEFO have increased the underlying cash balance by $24 million in 2010-11 and reduced the underlying cash balance by $40 million over the forward estimates. This $40 million reduction includes payments of $51 million that relate to a decision taken by the Department of Health and Ageing (under delegation from the Minister of Health and Ageing) to list new, and extensions to, medicines on the Pharmaceutical Benefits Scheme (PBS) from 1 August 2010. This policy decision reduces the underlying cash balance by $51 million over the forward estimates. This decision was taken early in July, and notified to the Department of Finance and Deregulation after the finalisation of the Economic Statement.
Between the 2010-11 Budget and the Economic Statement, parameter and other variations were expected to have a total positive impact on the underlying cash balance of $10.5 billion over the four years to 2013-14, including $538 million in 2010-11. Since the Economic Statement, parameter and other variations are expected to reduce the underlying cash balance by $362 million in 2010-11 and by $528 million over the four years to 2013-14. These variations are described in more detail below.
Table 4 provides a reconciliation of the underlying cash balance estimates between the 2010-11 Budget, the Economic Statement and the 2010 PEFO.
Table 4: Reconciliation of 2010-11 Budget, Economic Statement and
2010 PEFO underlying cash balance estimates

(a) Excludes expected Future Fund earnings.
(b) Excludes secondary impacts on public debt interest of policy decisions and offsets from the contingency reserve for decisions taken.
(c) Includes contingency reserve offsets to policy decisions.
Fiscal balance estimates
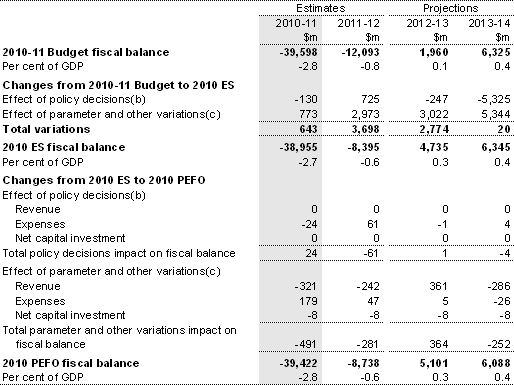
The impact of policy decisions on the fiscal balance is similar to that on the underlying cash balance. Further detail of all policy decisions taken since the 2010-11 Budget and up to the commencement of the caretaker period on 19 July 2010 is provided at Appendix B.
Between the 2010-11 Budget and the Economic Statement, parameter and other variations resulted in taxation revenue estimates being revised upwards by around $150 million in 2010-11 and by around $7.5 billion over the four years to 2013-14. A stronger outlook for commodity prices was reflected in expected stronger tax revenues on resource rents and company profits, offset in part by downward revisions in consumption taxes associated with the weaker consumption outlook.
Since the Economic Statement, updated information in regard to 2009-10 outcomes has led to taxation revenue estimates being revised downwards by around $300 million in each year of the forward estimates. The lower than previously anticipated collections relate to individuals’ income taxes and GST.
Non-tax revenue estimates for 2010-11 were largely unchanged between the 2010-11 Budget and the Economic Statement. Since then non-tax revenue has been revised downward, largely reflecting an expected fall in fee revenue from the Guarantee Scheme for large Deposits and Wholesale Funding of $120 million in 2010-11 ($256 million over four years) owing to lower than anticipated outstanding guaranteed liabilities. For 2012-13 and 2013-14, the Reserve Bank of Australia (RBA) dividend estimates have increased by $717 million. This primarily reflects the impact of a smaller anticipated valuation loss in 2009-10 stemming from exchange rate movements, which is expected to enable the RBA to resume dividend payments a year earlier than anticipated at the time of the 2010-11 Budget.
Between the 2010-11 Budget and the Economic Statement, parameter and other variations reduced the estimates of expenses for 2010-11 and across the forward estimates. In 2010-11, this primarily reflects:
- a reduction in GST payments to the States and Territories (consistent with the forecast reduction in GST collections) of $1.0 billion ($3.0 billion over four years to 2013-14); and
- a reduction in expected interest expenses of $514 million ($4.2 billion over four years).
These variations are partly offset by:
- an increase in a range of grant and other program expenses of $857 million (previously included in the estimates for 2009-10); and
- increased costs flowing from revised economic parameters of $61 million ($651 million over four years).
Since the Economic Statement, parameter and other variations have increased expenses by $179 million in 2010-11 largely reflecting the recognition of $243 million of expenses for road infrastructure that was previously expected in 2009-10 and a forecast increase in Child Care Rebate expenses of $56 million ($249 million over four years). These increases are partially offset by a forecast further reduction in GST payments to the States (consistent with GST revenue collections) of $90 million in 2010-11 ($440 million over four years).
The Contingency Reserve includes an allowance for the tendency for estimates of expenses for existing Government policy to be revised upwards in the forward years (the conservative bias allowance). This allowance is unchanged from the 2010-11 Budget. The Contingency Reserve also contains provisions for future increases in Australia’s Official Development Assistance yet to be allocated to specific aid programs ($2.8 billion over four years), the continuation of existing exceptional circumstances drought relief ($145 million in 2010-11), the ICT Business as Usual Reinvestment Fund ($447 million over four years) and for future equity investments in the National Broadband Network ($13.6 billion over three years to 2013-14).1 The Contingency Reserve also contains a number of items that cannot be disclosed for commercial-in-confidence or national security reasons.
Table 5 provides a reconciliation of the fiscal balance estimates.
Table 5: Reconciliation of 2010-11 Budget, Economic Statement and
2010 PEFO fiscal balance estimates

(a) A positive number for revenue indicates an increase in the fiscal balance, while a positive number for expenses and net capital investment indicates a decrease in the fiscal balance.
(b) Excludes secondary impacts on public debt interest of policy de
cisions and offsets from the contingency reserve for decisions taken.
(c) Includes contingency reserve offsets to policy decisions.
Net debt and net financial worth
Net debt for the Australian Government general government sector is estimated to be $80.6 billion (or 5.7 per cent of GDP) in 2010-11, which is broadly consistent with the forecast in the 2010-11 Budget and the Economic Statement.
Net financial worth is estimated to be -$166.8 billion (or -11.8 per cent of GDP) in 2010-11 in line with the Economic Statement. In the 2010-11 Budget net financial worth was estimated to be -$160.6 billion (or -11.4 per cent of GDP).
1 The profile of expenses in the contingency reserve for Official Development Assistance is $155 million in 2010-11, $233 million in 2011-12, $668 million in 2012-13 and $1,702 million 2013-14. The profile for the ICT Business as Usual Reinvestment Fund is $40 million in 2010-11, $118 million in 2011-12, $114 million in 2012-13 and $177 million in 2013-14.