Contributions to superannuation are treated differently according to whether they are sourced from employees, employers or the self-employed, and whether they are for funded or unfunded schemes.
Concessional Contributions
Up to the age based contribution limits (which still applied in 2005-06), contributions paid by an employer to a superannuation fund are tax deductible to the employer, the same as other wage and salary payments, and importantly do not form part of the taxable income of the employee. In these circumstances funds pay tax in respect of contributions received. We will call such contributions ‘concessional contributions’. These include ‘salary sacrifice’ contributions, which is the term commonly used for contributions to superannuation made by the employer on behalf of the employee which exceed that required by law, awards or the particular superannuation fund(s) to which the employee belongs. Concessional contributions can also be made by self-employed people. The basic tax rate is 15 per cent where the contributions are made to a complying fund. Some exceptions to Superannuation Guarantee (employer) contributions apply, including employees earnings less than $450 per month or employees under age 18 and working less than 30 hours per week or over the age of 70.
Charts 3 to 8 look only at the distribution by income, gender and age of contributions made by employers. Charts 9 to 12 consider the distribution by income, gender and age of contributions made by individuals out of after tax income. Charts 13 to 16 consider the distribution by income, gender and age of concessional contributions made by the wholly self-employed and others with little or no employer support.
In 2005-06 it is estimated that there were around 9.6 million individuals aged under 65 who received an employer contribution and this flow aggregates to around $49 billion before tax. It is estimated that around 62 per cent of the concessional superannuation contributions paid by their employers were on behalf of men. The median3 employer contribution was $2,598 for women and $3,607 for men. Chart 3 shows that the median employer contributions increase with total income4 (as expected), and for most incomes are very similar for men and women. The exception is that the median employer contribution for men in the highest income group is higher than for women reflecting that male total incomes are higher on average. Men and women with total income of $95,000 or more enjoy the largest median employer contributions, $10,577 and $9,309 respectively. Chart 5 shows that around 8 per cent of people receiving employer contributions are in this total income group.
Chart 4 generally shows that median employer contributions also rise with age (reflecting that incomes generally rise with age). The median employer contributions are quite similar for young men and women, but begin to noticeably diverge from around age 25. At all ages, men have larger median employer contributions than women and contributions for men peak at ages 50-54. The dip in median employer contributions for women aged 30 to 40 is due to a relatively high proportion of employed women working part-time in these age groups (the main child rearing years). Men and women aged 50-54 enjoy the largest median employer contributions, $4,958 and $3,164, respectively. At older ages median employer contributions for men and women once again begin to converge. Older males have relatively lower wages in part because they are more likely to be working part-time, and have relatively lower educational qualifications.
Chart 5 shows the distribution of men and women receiving employer contributions belonging to five different total income groups (the 2005-06 personal income tax thresholds). The proportion of women in lower income groups is above that of men, while a higher proportion of men than women have total incomes above $63,000. Chart 5 shows that a small majority of both males and females with employer provided superannuation have total incomes in the range of $21,601-$63,000, around 53 and 59 per cent respectively.
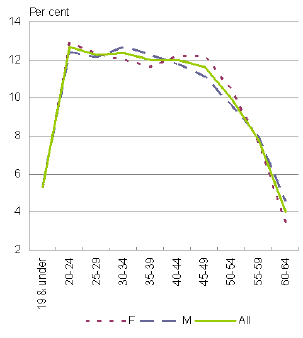
Chart 6 shows the distribution of all men and women receiving employer contributions in each of the 10 different 5 year age groups5. A relatively small proportion of people receiving employer contributions are aged under 19. This is because many people in this age group, if employed, are employed part-time. The peak for women is above that for men but both occur at age 20-24 when most people are in the labour force and receiving employer contributions. From ages 20 to 49 the proportions in each age group are relatively flat, although for women the proportion is slightly below that for men reflecting that they are proportionately more likely to work part-time due to child rearing. From ages 45 to 59 the proportion of women is generally higher than for men.
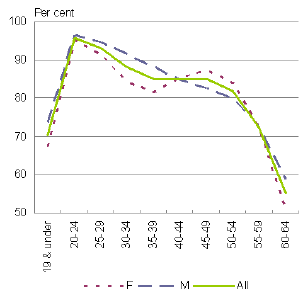
Chart 7 shows the proportion of those with an employer contribution as a proportion of those with and without an employer contribution and who lodge an income tax return (including the retired) within total income ranges. It is estimated that coverage peaks at 94 per cent and 98 per cent for men and women, respectively. The peak for women is in the $21,601-$63,000 total income range, while the male peak is in the $63,601-$95,000 total income range. By age the peaks are 96 per cent and 95 per cent for those aged 20-24 for men and women, respectively. Coverage generally increases with total income and declines across age ranges.
The ABS measure of superannuation coverage6 provided by their current employer for employees in their main job with earnings of between $52,000 and under $62,400 found that superannuation coverage was 97 per cent for males and 98.7 for females. This is very similar to our finding above.
Chart 3: Median employer provided super contributions by total income and gender in 2005-06
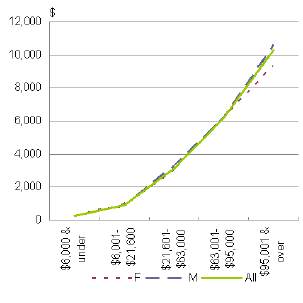
Chart 4: Median employer provided super contributions by age and gender in 2005-06
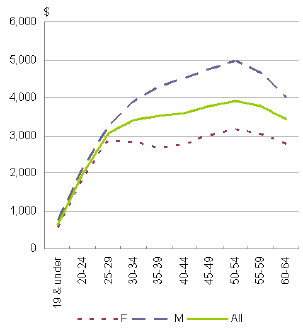
Chart 5: Distribution of those with employer provided superannuation by total income and gender in 2005-067
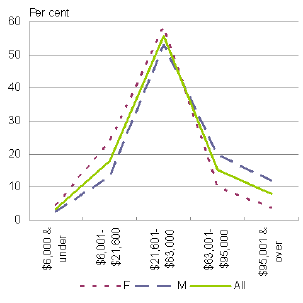
Chart 6: Distribution of those with employer provided superannuation by age and gender in 2005-06
Source: Treasury estimates based on the 2005-06 confidentialised Treasury sample files.
Chart 7: Coverage of males and females with employer provided super by total income and gender in 2005-068
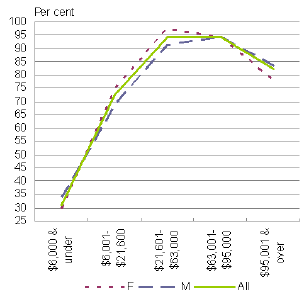
Chart 8: Coverage of males and females with employer provided super by age and gender in 2005-06
Source: Treasury estimates based on the 2005-06 confidentialised Treasury sample files.
Non-Concessional Contributions
Contributions made directly by employees and others (including the self-employed and the not employed) to superannuation funds are made from after tax income. No contributions of this nature are generally required by law and may be a condition of belonging to the fund nominated by the employer. No contributions tax applies, but earnings derived from such contributions are generally taxable at a maximum rate of 15 per cent. We use the term ‘non-concessional’ contributions for such contributions.
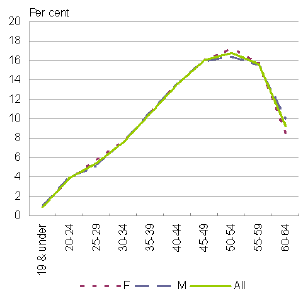
In 2005-06 it is estimated that there were around 2.4 million individuals aged under 65 who made non-concessional contributions and this flow aggregates to around $24.5 billion9. It is estimated that around 51 per cent of total non-concessional contributions were made by men. The median non-concessional contribution was $1,125 for women and $1,792 for men. Chart 9 and Chart 10 both show that median non-concessional contributions rise with income and age, particularly for women with total income in the range $21,601-$63,000 and above. Otherwise, median non-concessional contribution for both men and women are very similar. By age the median non-concessional contributions are higher for men across all age ranges. Men and women aged 60-64 enjoy the largest median non-concessional contributions, $2,433 and $2,026, respectively. Chart 12 shows that 9 per cent of people making non-concessional contributions are in this age group. Men and women with total income of $95,000 & over enjoy the largest median non-concessional contributions, $3,911 and $5,400, respectively. Chart 11 shows that 11 per cent of people making non-concessional contributions are in this total income group.
Chart 11 shows that the distribution of females making non-concessional contributions to superannuation exceeds that of men, except for the total income ranges of $63,001-$95,000 and $95,001 & over. Chart 11 also shows that the distribution of females and males making non-concessional contributions to superannuation peaks at around 63 per cent and 50 per cent, respectively in the total incomes range of $21,601-$63,000.
Chart 12 shows that the distribution of males and females making non-concessional contributions to superannuation rises with age up to and including the age group 50-54. Chart 10 shows that median contributions are also rising strongly with age. This could reflect that you are likely to have greater capacity to save from after tax income if you have been able to reduce expenditure on housing and child rearing, for instance. The percentage of men and women making non-concessional contributions to superannuation are quite similar across the age groups, peaking for both males and females in the 50-54 age range.
Chart 9: Median non-concessional contributions by total income and gender in 2005-06
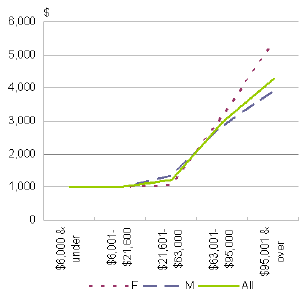
Chart 10: Median non-concessional contributions by age and gender in 2005-06
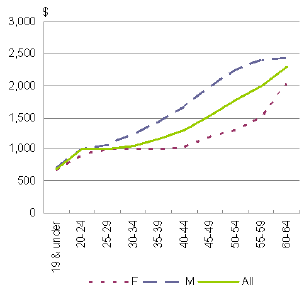
Chart 11: Distribution of those making non-concessional contributions by total income and gender in 2005-06
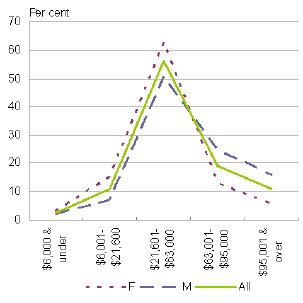
Chart 12: Distribution of those with making non-concessional contributions by age and gender in 2005-06
Source: Treasury estimates based on the 2005-06 confidentialised Treasury sample files.
Non-Employer Sponsored Superannuation Contributions
Up to the 2006-07 income year, superannuation contributions were deductible for income tax purposes in the year you made them, up to the age based limits. These limits applied to:
- employers and their associates claiming deductions for contributions made for the benefit of an employee, and
- certain individuals claiming a deduction for personal superannuation contributions.
In 2005-06, the age based limit were $14,603 for those under age 35, $40,560 for those aged 35 to 49 and $100,587 for those aged 50 to 70 (and 28 days). In order to reach your age based limit, you would need to have had contributions of around $17,804, $52,413 and $132,449, respectively. It is estimated that around 5 per cent of wholly self-employed and others with little or no employer support who claimed an income tax deduction for their contributions aged 35 and under made concessional contributions of $17,804. Similarly, this statistic is around 7 per cent for those aged 35 to 49 for those who made concessional contributions of $52,413 and around 8 per cent for those aged 50 to 70 who made concessional contributions 132,449.
In 2005-06 it is estimated that there were around 190,000 individuals aged under 65 who claimed a deduction for their concessional contributions and this flow aggregates to around $4.2 billion for the wholly self-employed and others with little or no employer support. It is estimated that around 58 per cent of these concessional superannuation contributions10 were claimed by men. The median contribution for these superannuation contributions was $6,500 for women and $4,400 for men. Chart 13 and Chart 14 both show that median concessional superannuation contributions rise with income and age, particularly for women. By income the median concessional superannuation contributions for women are generally higher than men except for total incomes in the range $6,001-$26,000 and below. Similarly, by age the median concessional superannuation contributions are generally higher for women across all age ranges, except for the 19 and under age group. Men and women aged 60-64 enjoy the largest median concessional superannuation contributions, $11,200 and $28,000, respectively. Chart 16 shows that 17 per cent of people making concessional superannuation contributions are in this age group. Men and women with total incomes of $95,000 & over enjoy the largest median concessional superannuation contributions of $15,000 and $52,400, respectively. Chart 15 shows that 35 per cent of people making concessional superannuation contributions are in this total income group.
Chart 15 shows that the distribution of females with non-employer provided superannuation exceeds that of men, except for total incomes of $95,001 & over. Chart 15 also shows that the percentage of females and males with non-employer provided superannuation peaks at around 40 per cent in the total incomes range of $21,601-$63,000.
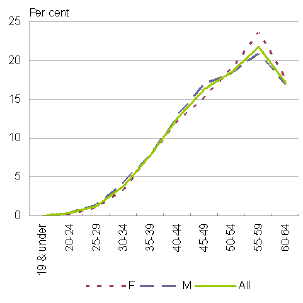
Chart 16 shows that the distribution of males and females with non-employer provided superannuation rises with age up to and including the age group 55-59. The percentage of men with non-employer provided superannuation generally exceeds that of women with non-employer provided superannuation, except for age ranges 50-54 through to 60-64.
Compared to the employed, the wholly self-employed and others with little or no employer support who claim an income
tax deduction for their contributions appear to making stronger concessional superannuation contributions, especially women. The median concessional superannuation contribution for a male with employer support is $3,607 and the median concessional superannuation contribution for a male without employer support is $4,400. Similarly, the median concessional superannuation contribution for a female with employer support is $2,598 and the median concessional superannuation contribution for a female without employer support is $6,500.
Chart 13: Median non-employer provided superannuation contributions by total income and gender in 2005-06
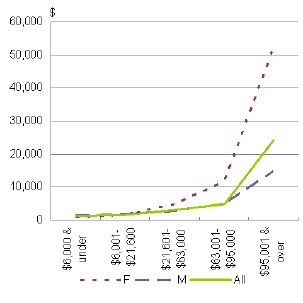
Chart 14: Median non-employer provided superannuation contributions by age and gender in 2005-06
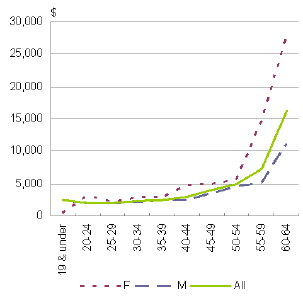
Chart 15: Distribution of those making non-employer provided superannuation contributions by total income and gender in 2005-06
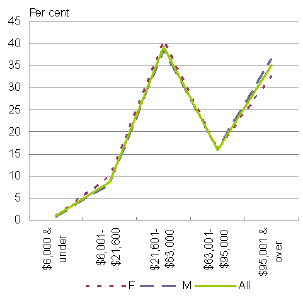
Chart 16: Distribution of those making non-employer provided superannuation contributions by age and gender in 2005-06
Source: Treasury estimates based on the 2005-06 confidentialised Treasury sample files.
Government Co-Contributions
From 1 July 2002, a Government Co-Contribution was introduced in place of the tax offset for personal superannuation contributions made by eligible low income earners. The Government Co-Contribution matches personal undeducted non-concessional contributions by low income earners made on or after 1 July 2002.
In 2005-06 a maximum Government Co-Contribution of $3,000 (usually $1,500) was payable in respect of individuals whose assessable income and reportable fringe benefits did not exceed $28,000 per annum (for a $1,000 eligible contribution by the individual). The maximum Government Co-Contribution is reduced by 5 cents for each dollar of assessable income and reportable fringe benefits over $28,000 (up to $58,000). The Government Co-Contribution is treated as a non-concessional contribution for tax purposes. To be eligible for the Government Co-Contribution, an individual must not be aged 71 or more in the year of making the eligible contribution and must be ineligible to claim a tax deduction for their personal contributions11.
In 2005-06 it is estimated that there were around 1.2 million individuals aged under 71 in receipt of a Government Co-Contribution and this flow aggregates to around $1 billion (before doubling12). It is estimated that around 36 per cent of Government Co-Contributions were paid to men. The median Government Co-Contribution (again before doubling) was $872 for women and $648 for men. Chart 17 shows that median Government Co-Contributions are $1,500 for total incomes at and below $28,000 and that the amount of Government Co-Contribution reduces beyond this total income owing to the Government Co-Contribution taper. By income and age the median Government Co-Contribution for women are higher than men, except where they are have total incomes at or below $28,000 where they have the same median Government Co-Contribution. Men and women aged 65-71 enjoy the largest median Government Co-Contribution, $1,010 and $1,169, respectively or around 2 per cent of persons with a Government Co-Contribution.
Chart 18 shows that median amount of the Government Co-Contribution rises with age, particularly for women. At younger ages (24 and under) the median amount of the Government Co-Contributions are relatively high. This age group represents around 8 per cent of Government Co-Contributions recipients.
Chart 19 shows that the distribution of females in receipt of a Government Co-Contribution exceed the percentage of men in receipt of a Government Co-Contribution at total incomes in the range $28,001-$39,999 and below. The opposite is true for the other income ranges ($40,000-$49,999 and above) in this chart.
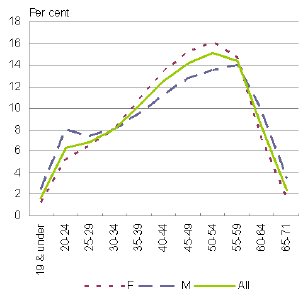
Chart 20 shows that the distribution of females in receipt of a Government Co-Contribution exceed the percentage of men in receipt of a Government Co-Contribution for age groups 30-34 through to 55-59. The opposite is true for the other age groups in this chart.
The Government Co-Contribution provides larger benefits to women than men and the proportion of women in receipt of a Government Co-Contribution is generally higher than that of men. This outcome reflects the generally higher numbers of women in the Government Co-Contribution total income ranges and the numbers making a non-concessional contribution.
Chart 17: Median Government Co-Contributions (before doubling) by total income and gender in 2005-06
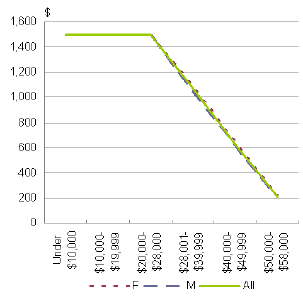
Chart 18: Median Government Co-Contributions (before doubling) by age and gender in 2005-06
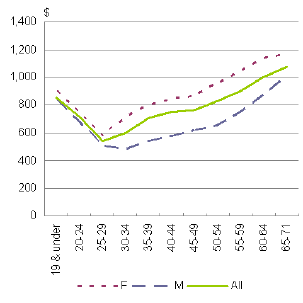
Chart 19: Distribution of those with Government Co-Contributions (before doubling) by total income and gender in 2005-06
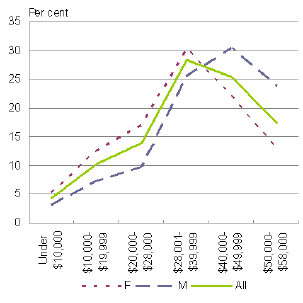
Chart 20: Distribution of those with Government Co-Contributions (before doubling) by age and gender in 2005-06
Source: Treasury estimates based on the 2005-06 confidentialised Treasury sample files.
3 The median of a set of numbers is the value that falls in the middle when the numbers are sorted in order of magnitude. For n such numbers, the median is the middle value where n is odd and the mean of the two middle values where n is even. The median has an intuitive appeal as a measure of central tendency. At most, half of the numbers fall below the median and at most half fall above. If your data has extreme values the mean will be distorted, so the median is often the preferred measure in such situations.
4 The definition of total income used throughout this paper generally refers to the income definition used for the Government Co-Contribution, namely assessable income for the income year plus their reportable fringe benefits total for the income year. For Chart 21, 23 and 25 we use total current income from all sources, as we cannot construct a completely consistent Government Co-Contribution income definition from the 2005-06 Survey of Income and Housing.
5 Technically, the 19 & under age group is not a five year age group, but age 0-14 does not constitute a large proportion of the 19 & under age
group with employer contributions.
6 Employee Earnings, Benefits & Trade Union Membership, ABS Cat. No. 6310.0 (August 2006).
7 Proportions within each gender grouping sum to one for Charts 5, 6, 11, 12, 15, 16, 19, 20, 23 and 24.
8 Proportions are for those with the variable of interest (an employer contribution in this case) as a proportion of those with and without the variable of interest within the same range (either total income or age). The population of those with and without a variable of interest is taken to be those who lodged a personal income tax return in 2005-06 (around 11.5 million individuals).
9 This is likely to include some re-contributions or recycling of contributions. This is discussed in more detail later in the paper. This amount also includes concessional contributions by the wholly self-employed and others with little or no employer support. This reflects how the data on the ‘personal contributed amount’ is collected on the SMCS.
10 This is the derived concessional contribution based on the amount claimed as a deduction in personal income tax returns.
11 In addition, 10 per cent or more of your total income must be from eligible employment and you must not held an eligible temporary resident visa at any time during the year.
12 This is only the 2005-06 entitlement before the additional payment announced in the 2007-08 Budget.