The Australian Government’s long-term fiscal sustainability has improved since the first intergenerational report in 2002 (IGR1), although demographic and other factors continue to pose substantial challenges for economic growth and long-term fiscal sustainability.
Fiscal sustainability is assessed by the ratio of government spending to Gross Domestic Product (GDP) or, equivalently, the ratio of government spending per person to GDP perperson, and its implications on net debt.
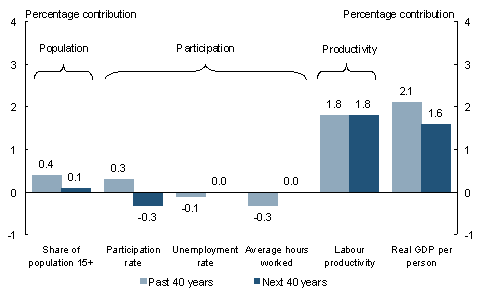
Over the next 40 years, the ageing of the population (specifically the impact of relatively fewer people of traditional working age) is projected to slow economic growth, with real GDP per person rising more slowly than in the past 40years: 1.6percentperyear on average over the next 40 years compared with 2.1percent over the past 40years.
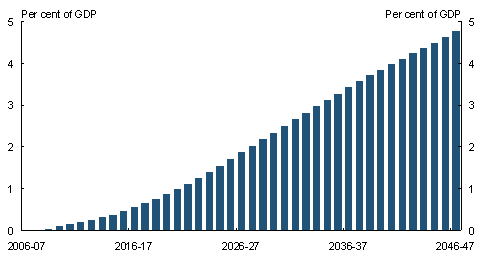
At the same time, spending pressures in areas such as health, age pensions, and aged care are projected to rise, due to demographic and other factors. Real Australian Government spending per person is projected to increase by 2per cent a year on average over the next 40 years. Accordingly, Australian Government spending is projected to rise by around 4percentagepoints of GDP by 2046-47. After taking into account the strong fiscal starting position of a surplus of just over 1per cent of GDP, the ‘fiscal gap’ or the amount by which spending is projected to exceed revenue will be around 3percent ofGDP by 2046-47. As a consequence, net debt is projected to re-emerge and rise rapidly, reaching around 30percent of GDP by 2046-47.
The outcome for the second intergenerational report (IGR2) compares to a projected fiscal gap in IGR1 of 5per cent of GDP by 2041-42. The improved outcome is due to a lower rate of growth of projected spending per person and higher projected nominal GDP per person compared to IGR1. The lower projected spending is mainly in health partly offset by increases in some areas such as education and aged care. The higher projected nominal GDP per person is predominantly attributable to the recent strong rise in the terms of trade. Higher labour force participation and skilled migration also have increased nominal GDP per person.
Steps to manage these fiscal pressures will need to continue, including managing the growth in government spending and lifting economic growth.
It will be important to focus on the efficiency and effectiveness of government spending including the potential role of market-based mechanisms in managing spending pressures. It also may be necessary to make choices about spending priorities as fiscal pressures associated with ageing and other factors emerge.
Policies to lift labour force participation and productivity will increase economic growth and GDPperperson. They need also to take account of other issues such as the possibility of exogenous shocks, international developments and long-term forces acting on the economy such as innovation, and increasing pressures on our natural resources and global climate.
The demographic, economic and fiscal projections in this report assist the policy debate about the choices governments can make today to improve the wellbeing of current and future generations of Australians.
Sound foundations for the future
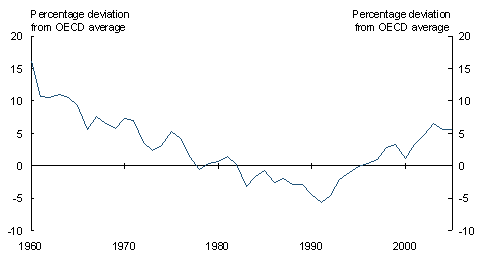
The economy has grown strongly in recent years and has performed better than many other countries (Chart 1). In the five years since IGR1, strong policy frameworks and steady progress in reform have improved the outlook.
Chart 1: Australian real GDP per person relative to OECD average
Note: OECD average is calculated for the 24 longest standing OECD member countries.
Source: Conference Board and Groningen Growth and Development Centre, Total Economy Database, January 2007.
Australia’s medium-term macroeconomic policy framework continues to underpin economic growth. A sustainable fiscal policy framework enables governments to manage their finances so they can meet their spending commitments, both now and in the future. Fiscal policy focused on sustainability also provides greater stability and certainty of future tax burdens. This supports informed long-term decision making, and encourages investment and economic growth.
Since IGR1, the Government has continued to deliver strong fiscal outcomes, by maintaining budget surpluses, eliminating net debt and establishing the Future Fund. In addition, spending pressures have begun to be addressed through measures such as reforms to the Pharmaceutical Benefits Scheme.
Complementing these strong macroeconomic and fiscal policy frameworks, reforms since IGR1 include policies designed to improve the drivers of economic growth, particularly participation and productivity. These include strengthening incentives to participate in the labour force and improving the flexibility of the labour market. Policy changes include reductions in personal income tax, family tax benefit adjustments, workplace relations changes, modifications to income support (including the Welfare to Work changes) and significant improvements to the superannuation system.
In addition, the Council of Australian Governments’ National Reform Agenda is focused on human capital and competition reforms to improve participation and productivity in the longer term. This represents a significant example of reforms that should be undertaken and which could address the implications of an ageing population sufficiently early to avoid large adjustments later.
Long-term demographic and economic projections
The ageing of the population continues to pose challenges for economic growth and the long-term fiscal outlook.
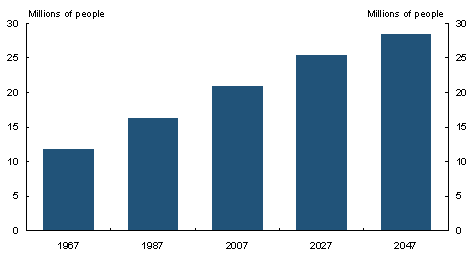
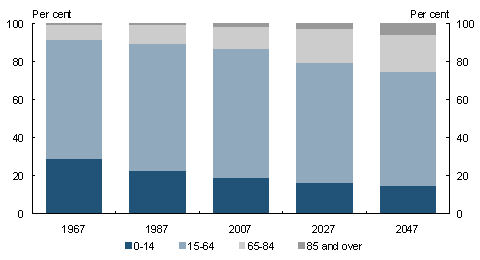
Australia’s population is projected to grow and continue to age over the next 40 years with the fastest rates of growth in the numbers of people aged 65 and over (Chart 2). Declining mortality rates leading to higher life expectancy, as well as the ageing of the baby boomer generation mean that about 25per cent of the population is projected to be aged 65 and over by 2047: the rate of ageing will quicken after 2010 (Chart 3). There have been positive developments in respect of the fertility rate which has increased recently, but it is still significantly below the replacement rate. The policy shift in recent years towards younger, skilled migrants is assumed to continue, partially offsetting the rate of population ageing.
Chart 2: Historic and projected Australian population
Source: Australian Bureau of Statistics data and Treasury projections.
Chart 3: Proportions of total Australian population in different age groups
Source: Australian Bureau of Statistics Historic Australian Population Statistics 3105.0.65.001 Table 19 and Treasury projections.
These demographic changes will lead to a reduction in the proportion of the population of traditional working age, 15-64 years. As a consequence of the subsequent flow through to the proportion of the population who work, this is projected to reduce the average rate of economic growth in the next 40 years.
The population of traditional working age, 15-64 years, is projected to grow by over 20percent by 2047, but to fall as a proportion of the total population by around 8percentage points to 60 per cent. The fastest gro
wing group of traditional working age people is that aged 55-64, rising by nearly 50 per cent over the next 40 years.
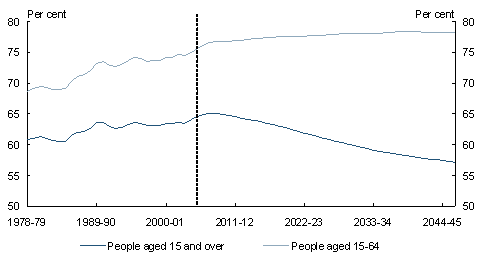
Total labour force participation rates (aged 15+) are projected to fall, reflecting the rapid increase in the proportion of the population aged 65 and over (Chart4). However, the recent lift in labour force participation for older workers is likely to remain significant and has softened the projected decline in labour force participation. Labour productivity is assumed to grow at its average rate of the past 30years.
Chart 4: Historic and projected labour force participation rates
Source: Australian Bureau of Statistics data and Treasury projections.
Overall, the combination of these factors points to a slowing of economic growth over the next 40 years (Chart 5), particularly during the 2020s when a substantial fall in the proportion of the population of traditional working age is projected, due to the retirement of the baby boomer generation.
Chart 5: Contributions to growth in real GDP per person
Source: Australian Bureau of Statistics data and Treasury projections.
Long-term fiscal projections
Demographic and other factors are projected to place significant pressure on government finances over the longer term and result in an unsustainable path for net debt towards the end of the projection period.
Australian Government spending is projected, in the absence of policy adjustments, to rise by around 4percent of GDP by 2046-47 (Chart6). By that time, a fiscal gap of around 3percent of GDP is projected to develop. This compares to a projected a fiscal gap of 5per cent of GDP by 2041-42 in IGR1 (Chart 7).
If surpluses are maintained to 2022-23 as projected, then net debt would not re-emerge until the mid-2030s but would rise very quickly to reach around 30per cent of GDP in 2046-47 and continue to increase after that date (Chart 8).
Chart 6: Projection of spending pressure
Source: Treasury projections.
Chart 7: Comparison of IGR1 and IGR2 projected primary balances
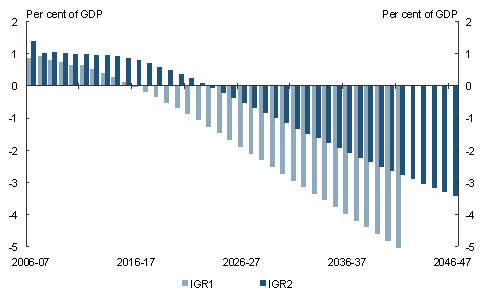
Note: The projections are of the primary balance (which excludes net interest payments and Future Fund earnings). The first four years of the IGR2 projections are primary balances based on the 2006-07 Mid-Year Economic and Fiscal Outlook adjusted for major government decisions announced since that time. Since IGR1, there have been some changes in projection methodologies incorporating new data and modelling approaches.
Source: Treasury projections.
Chart 8: Projected path of net debt
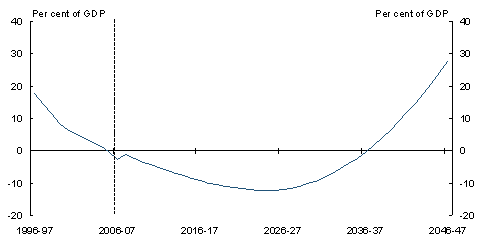
Note: The projections of net debt include net interest payments. The small increase in Australian Government net debt in 2007-08 reflects the expected change in the financial asset composition of the Future Fund as it moves towards a portfolio allocation consistent with the benchmark return specified in the Australian Government’s investment mandate.
Source: Treasury projections.
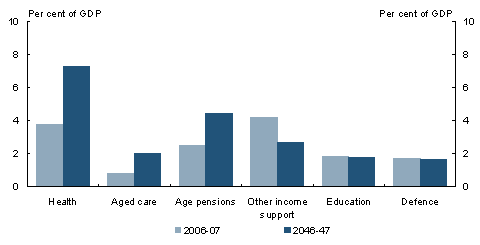
The main spending pressures continue to be in health, age pensions and aged care (Chart9). All these areas will be affected by gradual demographic change as well as non-demographic factors.
While an ageing population is projected to contribute to an increase in spending over the next 40 years, roughly two-thirds of the projected increase in real spending per person is driven by factors other than ageing. This is most notable for health spending, where a significant component of the projected increase is driven by non-demographic factors such as the development of new drugs.
Chart 9: Projections of Australian Government spending by category
Source: Treasury projections and assumptions.
Australian Government health spending is projected to continue to rise strongly and is the main spending pressure, even with recent policy changes. Spending on pharmaceutical benefits is projected to grow faster than Australian Government spending on hospitals, medical benefits and other areas.
The major influence on government spending on aged care is the number of people aged 85 and over and this number is projected to more than quadruple within the next 40years.
The strongest growth in income support payments over the projection period will be income payments to the aged including age pensions. However, the system of means-tested flat rate pensions puts Australia in a better position than many other OECD countries. Recent changes to simplify and streamline superannuation also should assist in relieving pressure in the longer term by encouraging higher retirement saving and longer workforce participation.