Private and household saving are often (incorrectly) used interchangeably when referring to Australias saving performance. As noted above, household saving as measured by the ABS refers only to saving by the household sector, including unincorporated enterprises. It does not include changes in the value of the household sectors interest in private corporations, whether by reason of changes in undistributed income or asset price fluctuations. On the other hand, private saving is the sum of saving by the private (financial and non-financial) corporation and household sectors. This key difference between household and overall private sector saving is vital in gaining a better understanding of what households consider to be their saving. However, it still needs to be borne in mind that, while the National Accounts measure of private saving takes into account the undistributed income of private financial and non-financial corporations, it generally does not include the effect of asset price fluctuations.
As private corporations are ultimately owned by households, saving by private corporations is, at least conceptually, also household saving. The extent to which households see through the corporate veil and adjust their saving (and consumption) decisions accordingly is not clear. It is likely that this will vary according to a range of factors, probably including how widely the corporations shares are held and the level of disclosure of financial information by the corporation.
Although the ABS does not publish a measure of overall private saving, it has previously published the gross profit of private non-financial and financial corporations, enabling a National Accounts consistent measure of private saving to be constructed. However, the ABS no longer separates the income of financial corporations between the private and public sectors. As such, it is no longer possible to derive private saving directly from ABS data. While it is possible to construct a measure of private saving by estimating the private-sectors share of the income of financial corporations, data limitations make this distinction in history difficult. The measures of private saving, private corporation saving and household saving in Chart 6 are derived from data calculated under the current National Accounts methodology employed by the ABS (SNA 93) to the extent it is available, supplemented by data calculated under the previous National Accounts methodology (SNA 68). However, as discussed in Appendix A, this is not the only approach that could be used to construct this measure.
An OECD study found that the offset (inverse correlation) between private corporation and household saving in the United States was between 50-75 per cent. Chart 6 suggests that there is a similar inverse relationship between household and corporate saving in Australia. In other words, the increase in the early to mid-1970s, and the downward trend since then, in private saving as a percentage of GDP is less pronounced than that for household saving. Whereas gross household saving rose from around 14 per cent of GDP in the 1960s to peak at little below 18 per cent of GDP in the mid-1970s, the rise in gross private saving was a little more modest, from around 19 per cent of GDP to around 22 per cent of GDP over the same period. Similarly, while the gross household ratio fell from a little below 18 per cent of GDP in the mid-1970s to around 7 per cent of GDP in 1997-98, the fall in gross private saving over this period was much more modest from around 22 per cent of GDP to around 15 per cent of GDP.
Chart 6: Components of gross private saving
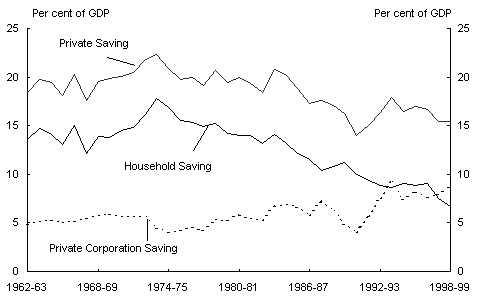
Source: ABS 5204.0, 5206.0 and Treasury estimates.
The trend in the measured private saving ratio in Australia has been broadly similar to that experienced in some other developed countries (see Chart 7). In Canada and the United States the measured private saving rate also increased in the 1970s before falling back to a little below the average rate for the 1960s, and in both countries is now at broadly similar levels as a percentage of GDP to the level in Australia. Japan has had a measured private saving ratio consistently higher than that of Australia, Canada and the United States. Its measured private saving ratio has been trending upwards slowly over the 1990s, widening the gap between Japans private saving ratio and that of the other countries in Chart 7.
Chart 7: Gross private saving international comparison
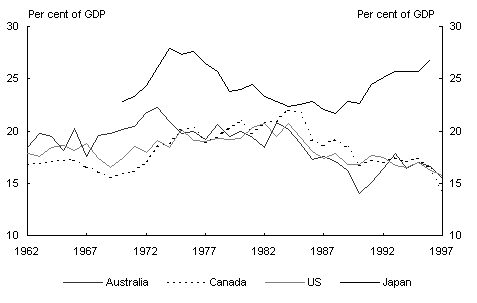
Source: OECD Annual National Accounts and Treasury estimates.
Inflation adjusted private saving measure
The measure of gross private saving outlined above includes, in the net income of the private sector, the nominal interest received on interest-bearing debt instruments less the nominal interest paid on debt. However, as noted in several previous studies, the nominal interest payment on debt has two components: a real component and an inflation component (the latter reflecting the change in the value of the loaned funds caused by inflation). As, conceptually, the inflation component of the interest payment represents a repayment of capital in real terms, it should not be regarded as income when received or an expense when paid. A number of researchers have argued that households distinguish between these components of interest receipts or payments. This implies that a measure of private saving which is adjusted for the effect of inflation on nominal interest receipts and payments is likely to be more representative of private saving behaviour.
As Chart 8 shows, the decline in the inflation-adjusted measure of gross private saving appears more muted. In summary, in the high inflation times of the 1970s, the inflation adjustment reduces the estimate of the gross private saving ratio significantly. In contrast, with much lower inflation in the 1990s, the inflation adjustment is much less significant and has the effect of increasing the measure of the gross saving ratio slightly, as the private sector interest bearing liabilities starts to exceed interest-bearing assets. Note that while the private sector has become a net debtor in relation to interest-bearing securities in the 1990s, the total assets of the private sector still exceeds its liabilities by a significant margin. In the ABS National Balance Sheet, the net worth of households has increased by an average real rate of around 4 per cent per annum since 1989-90 (see below). In other words, households have moved away from interest bearing deposits to other assets.
Chart 8: Inflation adjusted gross private saving
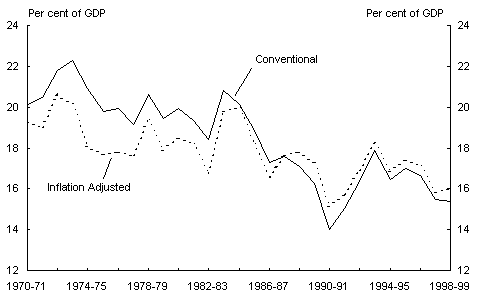
Source: Treasury update of estimates in Bartley and Phipps (1995).
It should be noted that although conceptually the household saving ratio could also be adjusted for the effects of inflation, data limitations render such adjustments impractical and/or unreliable. This is because the adjustment requires a detailed breakdown of cross holdings of interest bearing debts between the household and private corporation sectors. Such a breakdown is not required to adjust the private saving measure (as the cross holdings of interest bearing debts between the household and private corporation sectors cancel when aggregated to construct private saving). Neverthe
less, it is likely that the household saving ratio would be affected in a broadly similar manner as the gross private saving measure by the effects of inflation over this period.
Other issues in measuring private saving
There is also a range of other adjustments that could be made to the conventional measurement of private saving, to reflect more accurately underlying consumption/saving behaviour. These issues are discussed briefly below.
Consumer durables
The ABS classifies as consumption all of the expenditure by households on goods, including expenditure on consumer durables (broadly, goods that produce benefits beyond the year in which they were purchased). Several studies have argued that, conceptually, expenditure on consumer durables should be capitalised and apportioned to the periods in which the benefit from the durable good accrues. In practice, where the expenditure on consumer durables is relatively constant as a share of income, these adjustments are likely to largely cancel each other out.
The exclusion of consumer durables from final consumption would clearly lead to an increase in the measured level of gross household and private saving as a proportion of disposable income. However, the more relevant issue is how the classification of expenditure on consumer durables affects the longer term trend in saving measures. Where expenditure on consumer durables is constant as a proportion of disposable income, the classification of consumer durables will not affect the underlying trend in saving measures significantly. However, where the expenditure on consumer durables rises (or falls) as a proportion of disposable income, its classification can have a significant effect on the trend in measures of gross saving.
Chart 9 shows that expenditure on consumer durables declined as a proportion of disposable income from around 14 per cent in the early 1960s to around 12 per cent at the start of the 1980s, after which it has remained broadly constant. As all expenditure on consumer durables is classified as final consumption, there is an inverse relationship between the rate of consumer durable expenditure and National Accounts measures of saving. Thus, the higher rate of consumer durables expenditure in the 1960s and 1970s suggests a downward bias in saving measures over this period relative to the 1980s and 1990s, where the rate of consumer durables expenditure was lower.
Chart 9: Expenditure on consumer durables(a)
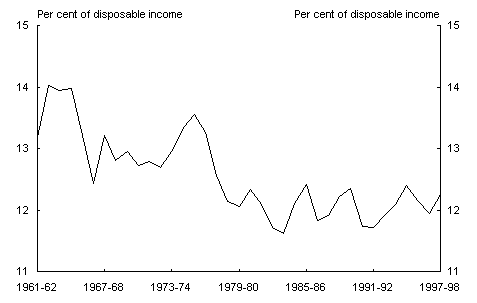
(a) Expenditure on consumer durables is defined as including furnishings, household equipment, and goods for recreation and culture. These categories include some items that probably are not consumer durables, such as non-durable household goods, as more detailed disaggregation of this expenditure is not available.
Source: ABS Cat. No. 5204.0.
Investment in human capital
On the other hand, it has been argued that increased expenditure on the development of human capital has tended to depress saving measures over recent decades. Several studies have noted that education and health expenditure, currently classified as consumption, have at least an element of investment in that they are likely to give rise to future benefits.
Depta, Ravalli and Harding (1994) separated private sector expenditures on education and health into (immediate) consumption and investment components. They found that investment in education by the private sector increased from around per cent of GDP in the 1960s to around 1 per cent of GDP at the start of the 1990s. Although health investment was found to have increased from 2 per cent of GDP to 4 per cent of GDP over the same period, this was almost entirely attributable to the public sector.
Unlike consumer durables, this increase in the share of GDP devoted to investment in human capital over time suggests that the treatment of such expenditure as consumption has resulted in a downward bias in the trend in private saving measures over recent decades.
The impact of capital gains tax on saving measures
Both the ABS household saving ratio and the private saving measure derived from the National Accounts, as outlined above, reduce the amount of saving by the household and private sector respectively for the effects of various taxes on income, including capital gains tax. However, capital gains (either realised or unrealised) are not included in the income of these sectors. This inconsistency results in a negative bias on these measures of private saving.
One approach to addressing this issue is to include taxable net capital gains in the definition of income of these sectors. Although this would be relatively straight-forward for the household sector, it would, in turn, raise additional consistency issues. For example, why would capital gains or losses that are untaxed be excluded from such an adjustment? This adjustment is much more problematic for the private sector as a whole, as it would require a complex consolidation process to avoid double counting.
A simpler, although perhaps less conceptually pure, approach to achieving consistency is to disregard (ie, add back in) capital gains tax in arriving at saving measures. The rationale for this approach is that if an item is not included in the income component of a saving measure then consistency requires that a tax on that item should not be included in the expense component of the measure. This adjustment increases the measured level of the household and private saving.
Statistical revisions and discrepancies
The National Accounts measures of private saving outlined above involve, in effect, the subtraction of an item measured on an expenditure basis from a combination of income accounts. Implicitly, this assumes that there is no discrepancy between these numbers. However, while in principle these measures of output should be equivalent, in practice as the data sources for each measure are independent they can produce different results. As a result, a balancing adjustment referred to as the statistical discrepancy is required to reconcile these measures.
Several studies have noted the potential for the statistical discrepancy to have an impact on private saving measures. For example, if the statistical discrepancy is positive that is, output on the income measure exceeds that on the expenditure measure this suggests that either income is overstated, expenditure is understated or both. Edey and Britten-Jones (1990) found that where the statistical discrepancy was subtracted from the private saving measure, the trend over recent decades did not appear to be disturbed. As they noted, this is likely to be the maximum impact of the discrepancy between the expenditure and income accounts on the private saving measure.
Chart 10 illustrates the size of the likely maximum adjustment to the private saving measure by showing the statistical discrepancy as a percentage of GDP. The positive statistical discrepancy through the 1960s to the mid-1970s, and in the late 1980s, may have resulted in measured private saving being overstated over these periods, particularly in the mid-1970s where the statistical discrepancy was around 2 per cent of GDP. Conversely, the negative statistical discrepancy from the late 1970s to the mid-1980s, and in the early 1990s, suggests that measured private saving may have been understated over these periods.
Chart 10: Size of statistical discrepancy as a per cent of GDP
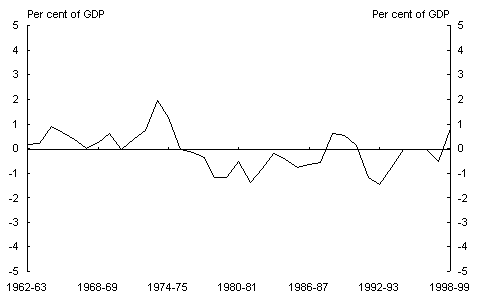
Source: ABS Cat. No. 5204.0, 5206.0.
Beginning with 1994-95, and for each subsequent year up to the year prior to the latest complete financial year (currently 1996-97 for the annual National Accounts and 1997-98 for the quarterly National Accounts), balanced supply and use tables have enabled the ABS to reconcile the differences between the three broad approaches to measuring GDP. As a result, the same measure of GDP is obtained regardless of approach, so the quarterly statistical discrepancies in these financial years sum to zero. However there is currently a non-zero statistical discrepancy for the 1997-98 and 1998-99 financial year, as the balanced supply and use table for these years has not yet been compiled.
Net private saving
A downward trend over recent decades is somewhat more evident in the net private saving measure. Chart 11 compares the gross, net and inflation-adjusted net private saving measures over time. Although movements in these measures of private saving have been broadly similar over recent decades, the net private saving measures have fallen a little more as private sector depreciation as a percentage of GDP has increased, although, as with the gross saving measure, adjusting the net private saving measure for inflation reduces the extent of this decline. More detail on the calculation and components of net private saving is contained in Appendix B.
Chart 11: Comparison of net and gross private saving
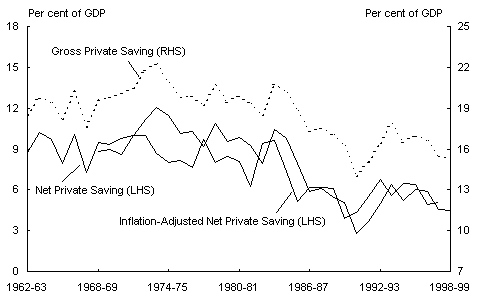
Source: ABS Cat. No. 5204.0, 5206.0 and Treasury estimates.
7 The principal exception being the extent to which asset price fluctuations reflect the capitalisation of undistributed income.
8 That is, the retained profits or undistributed income of corporations.
9 Although to obtain saving by Australian households it is necessary to adjust this amount to reflect net foreign holdings.
10 Dean et al (1989).
11 The caution in footnote 1 about cross country comparisons of saving measures is equally applicable here.
12 The merits in applying the above adjustments to interest payments and receipts have been acknowledged by Anstie, Gray and Pagan (1982), as well as several other researchers, including Makin (1990, 1995), O'Mara and Walshaw (1992), Access Economics (1992), Nevile (1993), Fitzgerald (1993), Flynn (1993) and Bartley and Phipps (1995).
13 By limiting the inflation adjustment to interest-bearing debt, it is implicitly assumed that (in aggregate) an increase in value of the underlying non-interest bearing assets compensates the owners of these assets for the effects of inflation.
14 See for example, Eisner (1988), Makin (1990, 1995), Depta, Ravalli and Harding (1994).
15 In other words, as a proportion of disposable income, new investment in consumer durables broadly offsets the depreciation of the existing stock of durables.
16 For example, due to exemption, indexation or transitional rules.
17 In this case it is the statistical discrepancy on the expenditure account less the statistical discrepancy on the income account. In practice this simplifies to output on the income basis less output on the expenditure basis.
18 See for example Gregory (1989), Edey and Britten-Jones (1990) and Fitzgerald (1993).
19 The statistical discrepancy is subtracted in this instance as it is assumed that a positive discrepancy means that either income is lower or final consumption is higher than implied in the private saving measure, both of which reduce the private saving measure.
20 See ABS information paper, Upgraded Australian National Accounts for further explanation.
21 Although the statistical discrepancy has been eliminated for the 1997-98 financial year in the quarterly national accounts, this will not be translated to the additional detail of the annual national accounts (used in calculating the private saving measure) until the 1998-99 annual national accounts are released.