This paper analyses the various available measures of household and overall private saving, with a particular focus on their strengths and weaknesses from a conceptual and practical perspective. The paper is intended as an overview of the important factual information on the measurement of saving in Australia.
Executive Summary
The most commonly quoted measure of saving is the net household saving ratio, as published by the ABS. It is determined residually and can be affected by underlying measurement and classification problems. As such, it may not provide an accurate indication of the underlying saving behaviour of households.
The pure economic definition of saving is the change in the wealth or net worth of households from one period to the next. In this context, an important limitation of conventional measures of saving is that they do not take into account the effect of changing asset values on the wealth of households. There have been several attempts to estimate Australian net private sector wealth. Although such measures are inherently volatile, they suggest that saving through the 1990s has exceeded the long run average.
Consideration of possible alternative measures of saving raises questions as to how the measure itself is to be defined and how to define (especially over time) sectors in the economy. There are conceptual and practical arguments about whether to use a gross or a net (that is, gross saving less depreciation) measure of saving. The net household saving ratio can be affected by the approach used for the measurement of depreciation. For example, the use (consistent with international standards) of replacement cost in depreciating dwellings means that when the cost of building a house increases, the measured household saving ratio may fall even though household net worth, at least initially, increases. Further, international comparison of net saving measures is difficult because the methods for calculating depreciation vary significantly across countries. As a result, gross measures of saving enable international comparisons to be more soundly based.
The household sector is defined as including both individuals and unincorporated enterprises. Consequently, changes in the structure of the business sector, particularly small business, can have a significant effect on whether income (and hence saving) is classified as belonging to the household or the corporate sector. The trend towards incorporation over recent decades suggests that some of the saving that was previously measured as accruing to the household sector would now be measured as accruing to the corporate sector.
As a result, it may be more accurate to assess trends in private saving as a whole rather than the saving of the household sector. The measure of private saving which can be derived from the National Accounts takes into account household saving and the undistributed income of private corporations. However, it generally does not include the effect of asset price movements. The increase in private saving as a percentage of GDP in the early to mid-1970s, and the downward trend since then, is much less pronounced than that of household saving. Gross private saving rose from around 19 per cent of GDP to around 22 per cent of GDP in the early to mid-1970s, and is currently around 15 per cent of GDP. A similar trend is evident in some other developed countries. By comparison, household saving in Australia is currently around 3 per cent of net household disposable income, compared with an average of around 11 per cent in the 1960s and a peak of around 18 per cent in the mid-1970s.
Several studies have noted that traditional measures of saving are distorted by the National Accounts inclusion of interest receipts and payments on a nominal rather than real (post inflation) basis. A measure of private saving which is adjusted for the effects of inflation on nominal interest receipts and payments is likely to be more representative of private saving behaviour. After the gross private saving measure is adjusted for inflation, the decline since the mid-1970s appears more muted, with the current inflation adjusted private saving rate around 3 per cent of GDP lower than it was at the end of the 1960s.
The net (of depreciation) private saving measure that can be derived from the National Accounts is more suggestive of a downward trend over recent decades than the gross private saving measure. Net private saving (unadjusted for inflation) rose from an average of 9 per cent of GDP in the 1960s to around 12 per cent in the mid-1970s and is currently around 4 per cent of GDP, about 2 per cent of GDP below the average of the past two decades. Adjusting the net private saving measure for inflation reduces the extent of this decline. That said, the current inflation adjusted net private saving rate is around 4 per cent of GDP lower than it was at the end of the 1960s.
A range of other adjustments could be made to the conventional measurement of private saving to reflect more accurately the conceptually pure definition of saving. These include the treatment of consumer durables and investment in human capital, the impact of capital gains tax of saving measures and the treatment of the statistical discrepancy.
In summary the significant decline in the ABS net household saving ratio since the mid-1970s appears to reflect measurement and classification limitations rather than a significant change in saving behaviour. Broader measures of the saving behaviour of Australian households, such as gross and net private saving (particularly after adjustment for inflation) and changes in net worth, present a different picture. While there are uncertainties about the appropriate definition and measurement of saving, these broader measures of private saving have shown a much less pronounced downward trend than the ABS net household saving ratio over recent decades.
Introduction
This paper analyses the various available measures of household and overall private saving, with a particular focus on their strengths and weaknesses from a conceptual and practical perspective. The paper is intended as an overview of the important factual information on the measurement of saving in Australia.
Measures of Household and Private Saving
There is a range of measures of household and overall private sector saving. This section discusses several such measures, with a particular focus on conceptual and practical measurement issues.
Household saving
The most commonly quoted measure of household saving in Australia is the net household saving ratio published as a memorandum item by the Australian Bureau of Statistics (ABS) in its National Accounts publications. The net household saving ratio is defined by the ABS as the proportion of the net disposable income of all households that is not consumed by households in that period. In this context, net disposable income is the gross disposable income of the household sector net of depreciation on the capital assets of the household sector in the period.
As illustrated in Chart 1, the ABS net household saving ratio averaged around 11 per cent of net household disposable income in the 1960s, rising to a peak around 18 per cent in the mid-1970s. According to this measure, the net household saving ratio fell from around 13 per cent to around 6 per cent over the course of the 1980s, and from around 6 per cent to around 3 per cent thus far over the course of the 1990s.
Chart 1: ABS net household saving ratio

Source: ABS Cat. No. 5206.0.
The trend in this measure of household saving in Australia has been broadly similar to that experienced in some other developed countries (see Chart 2). For example, although the measured household saving ratio did not peak quite as high in the United States in the 1970s and hit a higher peak in Canada in the early 1980s, since then the ratio in these two countries has trended down to be at historically low levels. Japan, generally considered a high saving country, has a measured household saving ratio consistently about 7 to 10 per cent higher than the United States, Canada and Australia, but this ratio also declined over the period between the mid-1970s and late 1980s. During the 1990s, Japans household saving ratio has been relatively steady.
Chart 2: Household saving ratios international comparison
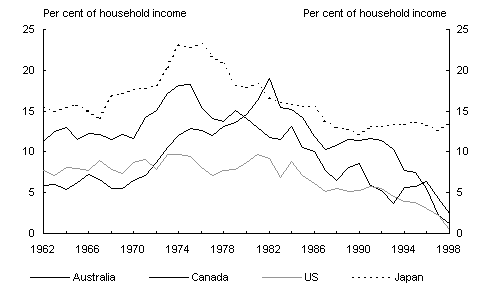
Source: OECD Economic Outlook No. 65.
Gross versus net household saving
There are conceptual and practical arguments about whether to use a gross measure or a net (that is, gross saving less depreciation) measure of saving.
From a conceptual point of view, net saving is appropriate because it more closely reflects the theoretical notion of saving representing the change in the wealth or net worth of households from one period to the next. However, net saving can be affected by the approach used for the measurement of depreciation, including whether depreciation is calculated using a capital stock that is valued at historical or current cost and the amortisation method employed. For example, consistent with international standards, current cost is used to estimate the depreciation of dwellings (a significant component of household depreciation); however where the price of new houses rise, the consequent increase in the value of the existing stock of dwellings is not included in household income. This means that when the price of new houses increase, the measured household saving ratio may fall even though household net worth, at least initially, increases.
Chart 3 compares the gross household saving ratio with the net household saving ratio over the past four decades. Using the gross household saving ratio measure, the apparent decline in household saving over recent decades is muted slightly, as is the rise in household saving in the mid-1970s.
Chart 3: ABS gross and net household saving ratios
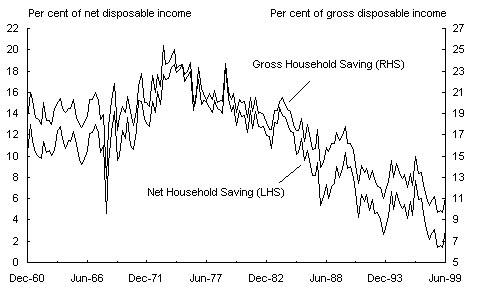
Source: ABS Cat. No. 5206.0.
The gap between the gross and net household saving ratios reflects the estimated depreciation of household capital assets, as measured by the ABS. The annual rate of depreciation of the household capital stock used by the ABS in constructing these measures was broadly constant during the 1960s at around 6 per cent. This fell to a broadly constant annual rate of 4.5 per cent in the 1970s, as the increased share of dwellings in the household capital stock (which depreciate at a lower rate) more than offset the effects of increases in new house prices. As illustrated in Chart 3, this fall in the rate of depreciation led to a narrowing of the gap between the gross and net household saving ratios in the early 1970s.
The subsequent widening of the gap between the gross and net household saving ratios in the mid to late 1980s reflects the rapid increase in the value of the household capital stock due largely to sharply higher new house prices which, in turn, led to increased levels of depreciation. For example, the ABS estimates that the value of the housing capital stock increased by 70 per cent between 1986-87 and 1989-90.
International comparison of net saving measures is difficult because the methods for calculating depreciation vary significantly across countries. As a result, gross measures of saving enable international comparisons to be more soundly based.
A broader measure of household saving which includes saving by unincorporated enterprises
It is often assumed that a clear delineation exists between saving by the household and business sectors. However, in practice this distinction is not clear cut, particularly in relation to unincorporated enterprises. Reflecting data limitations and consistent with international standards the household sector as measured by the ABS includes, amongst other things, the gross profit of unincorporated enterprises (eg, sole traders and partnerships). The ABS notes that household and unincorporated enterprises are included in the one sector because the owners of ordinary partnerships and sole proprietorships frequently combine their business and personal transactions.
Consequently, changes in the structure of the business sector, particularly small business, can have a significant effect on whether income (and hence saving) is classified as belonging to the household or the corporate sector. In particular, recent decades have seen a significant trend towards corporatisation by Australian business. This can be illustrated by the steady increase in the proportion of gross profit earned through company structures and the corresponding decline in the proportion earned by unincorporated businesses (Chart 4).
Chart 4: Share of gross profit corporate and unincorporated enterprises
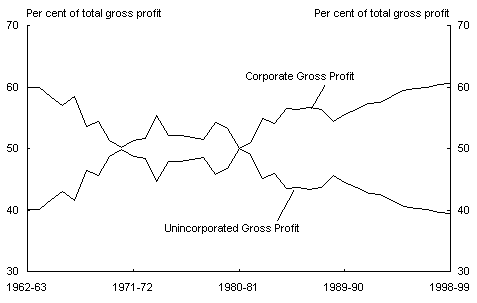
Source: ABS Cat. No. 5206.0.
There are several possible factors that could explain this trend towards corporatisation by Australian business. Corporatisation, for example, offers limited liability and other commercial advantages.
The consequences of this trend toward corporatisation on the measurement of the household sector saving ratio are often overlooked. To the extent that the increasing corporatisation of Australian business reflects changes in the structure of the small business sector, then (unless all corporate profits are distributed to households as dividends) the income measured as accruing to the household sector will be lower than otherwise. This is because the ABS measure of household income includes dividends paid from the corporate sector to the household sector but does not include the household sectors interest in undistributed income of the corporate sector (even when realised as a capital gain).
On the other hand, the relationship between small business households consumption and the income of their business is unlikely to be affected significantly by whether their business is incorporated or unincorporated. Therefore, the trend towards corporatisation by Australian enterprises is likely to have reduced the measured household saving ratio over time, as income attributed to the household sector will decline relative to household consumption.
An illustration of the magnitude of this shift on the gross household saving ratio can be gauged by estimating what the gross household saving ratio may have been under the assumption that unincorporated enterprises current share of gross profits had prevailed over the past three decades (see Chart 5). Under this assumption, the fall in the gross household saving ratio from the early-1970s is much less pronounced and, while the current level of the ra
tio is still low by historical standards, it is higher than its level for most of the 1960s.
That said, there is a range of technical and data difficulties in making such an adjustment and hence the results should be regarded as only being indicative of broad trends. It also points to the potential benefit in examining trends in overall gross private saving (which is unaffected by such structural changes) rather than the much more narrow definition of household saving. This issue is discussed further below.
Chart 5: Gross household saving ratio adjusted for a constant share of gross profit
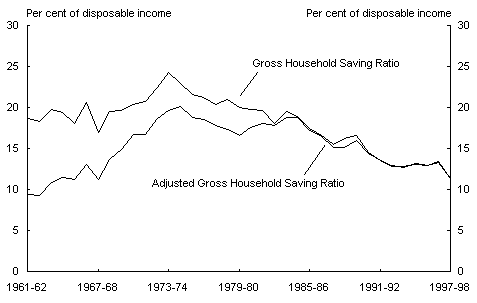
Source: ABS Cat. No. 5204.0 and Treasury estimates.
1 Australian Bureau of Statistics, Australian System of National Accounts, Catalogue Number 5204.0; National Income, Expenditure and Product, Catalogue Number 5206.0.
2 Depreciation is referred to in the National Accounts as 'consumption of fixed capital'.
3 Measures of the household saving ratio are not strictly comparable across countries because each country produces its national accounts using its own conventions that often differ substantially. As a consequence, the discussion is restricted to a comparison of broad underlying trends.
4 In ABS publications, gross profit is known as the gross operating surplus.
ABS, Australian National Accounts - Concepts, Sources and Methods, ABS Cat. No. 5216.0, page 16.
5 Adjusted such that dividend flows to households remain fixed through history at their current levels as a proportion of income.